


Visa (V) and Mastercard (MA) looked similarly priced at the November 4 close: about 35 times the earnings measures available for each company. That apparent tie hides a reversal. Two years earlier, the same dated calculation put Visa near 30 times earnings and Mastercard above 38 times. Visa's multiple has risen as Mastercard's has fallen. In this three-date comparison, the same headline P/E poses different tests: Visa's higher multiple must remain supported by its operating strength, while Mastercard's services growth must earn its way through customer incentives and into durable cash.
At the same time, both companies have reported strong revenue growth without equally strong recent growth in a simple cash-flow measure.
The investment question is therefore sharper than "which network is better?" It is what durable earnings and cash generation are required to justify the price now paid for each?
Sources: Visa fiscal 2026 release; Mastercard September 2026 filing.
The businesses are close enough to compare but their reporting calendars are not. Visa's fiscal year ends in September; Mastercard's ends in December. The table brings both to the twelve months ending September 30, 2026. Mastercard's trailing figures are its 2025 full year plus the first nine months of 2026 minus the first nine months of 2025.
The cash measure is operating cash flow less purchases of property, equipment and technology; for Mastercard it also subtracts capitalized software. It excludes acquisitions and is not a GAAP subtotal.
Twelve months to September 30, 2026 | Visa | Mastercard |
|---|---|---|
Net revenue | $45.903 billion | $36.288 billion |
GAAP operating margin | 61.2% | 58.6% |
Operating cash flow less capital investment | $22.057 billion | $15.430 billion |
That cash measure / revenue | 48.1% | 42.5% |
November 4 price / GAAP earnings proxy | 35.4× | 35.2× |
Sources: Visa fiscal 2026 results, Mastercard's September 2026 10-Q and 2025 10-K. Prices are November 4 closing prices. Mastercard's earnings-per-share proxy stitches published annual and nine-month diluted EPS; different diluted share counts make it approximate.
The operating case for paying a premium
Visa's fiscal 2026 revenue rose 15% to $45.9 billion. Its $28.1 billion of operating income represented a 61.2% margin. Processed transactions rose 9%, and total cross-border volume rose 13%. Those results show a large network still adding meaningful volume and earning heavily on each dollar of net revenue.
Mastercard's first nine months of 2026 produced $27.5 billion of revenue, also up about 15%. Its payment-network revenue grew 11%; value-added services and solutions grew 20% to $11.3 billion. The services business is a plausible source of growth beyond the core transaction network, although its growth rate alone cannot prove future consolidated returns.
Sources: Visa release; Mastercard 10-Q.
These are two highly profitable enterprises, but a comparison based only on operating margins would favor Visa too easily. Visa's twelve-month operating margin was about 2.6 percentage points higher; Mastercard's nine-month operating margin improved from 58.3% to 59.5% year over year.
Neither observation tells us what the next dollar of growth will cost, or when it will arrive as cash. Buybacks also make return-on-equity comparisons harder to interpret, so I do not use ROE to select a winner.
The cash question behind the headline growth
In fiscal 2026, Visa generated $23.728 billion of operating cash flow and spent $1.671 billion on property, equipment and technology. The difference, $22.057 billion, was about 2.2% above fiscal 2025 on the same definition, although revenue rose about 14.8%.
But the cash-flow statement's accrued-litigation adjustment swung from positive $1.303 billion in 2025 to negative $2.040 billion in 2026, a $3.343 billion year-over-year change.
That swing is much larger than the $480 million increase in the cash measure. It materially distorts any simple reading of the growth gap; reversing that line alone would not yield a reliable normalized cash-flow figure.
The useful question is how much revenue growth becomes repeatable cash after litigation payments and other timing effects settle.
Source: Visa cash-flow statement.
Mastercard presents a similar question over a different period. For the first nine months of 2026, operating cash flow was $11.859 billion. Subtract $667 million of property and equipment purchases and $474 million of capitalized software, and the remaining $10.718 billion is about 8.6% below the comparable 2025 figure.
Revenue rose about 14.6% in those nine months. Mastercard says higher customer-incentive payments, cash paid for litigation settlements and timing of customer settlements more than offset higher net income after noncash adjustments in operating cash flow.
Settlement timing can reverse; incentives may also be an ongoing cost of winning volume. The nine-month decline does not, by itself, show deteriorating underlying economics. It warrants tracking cash conversion across more periods.
Source: Mastercard cash flows and revenue.
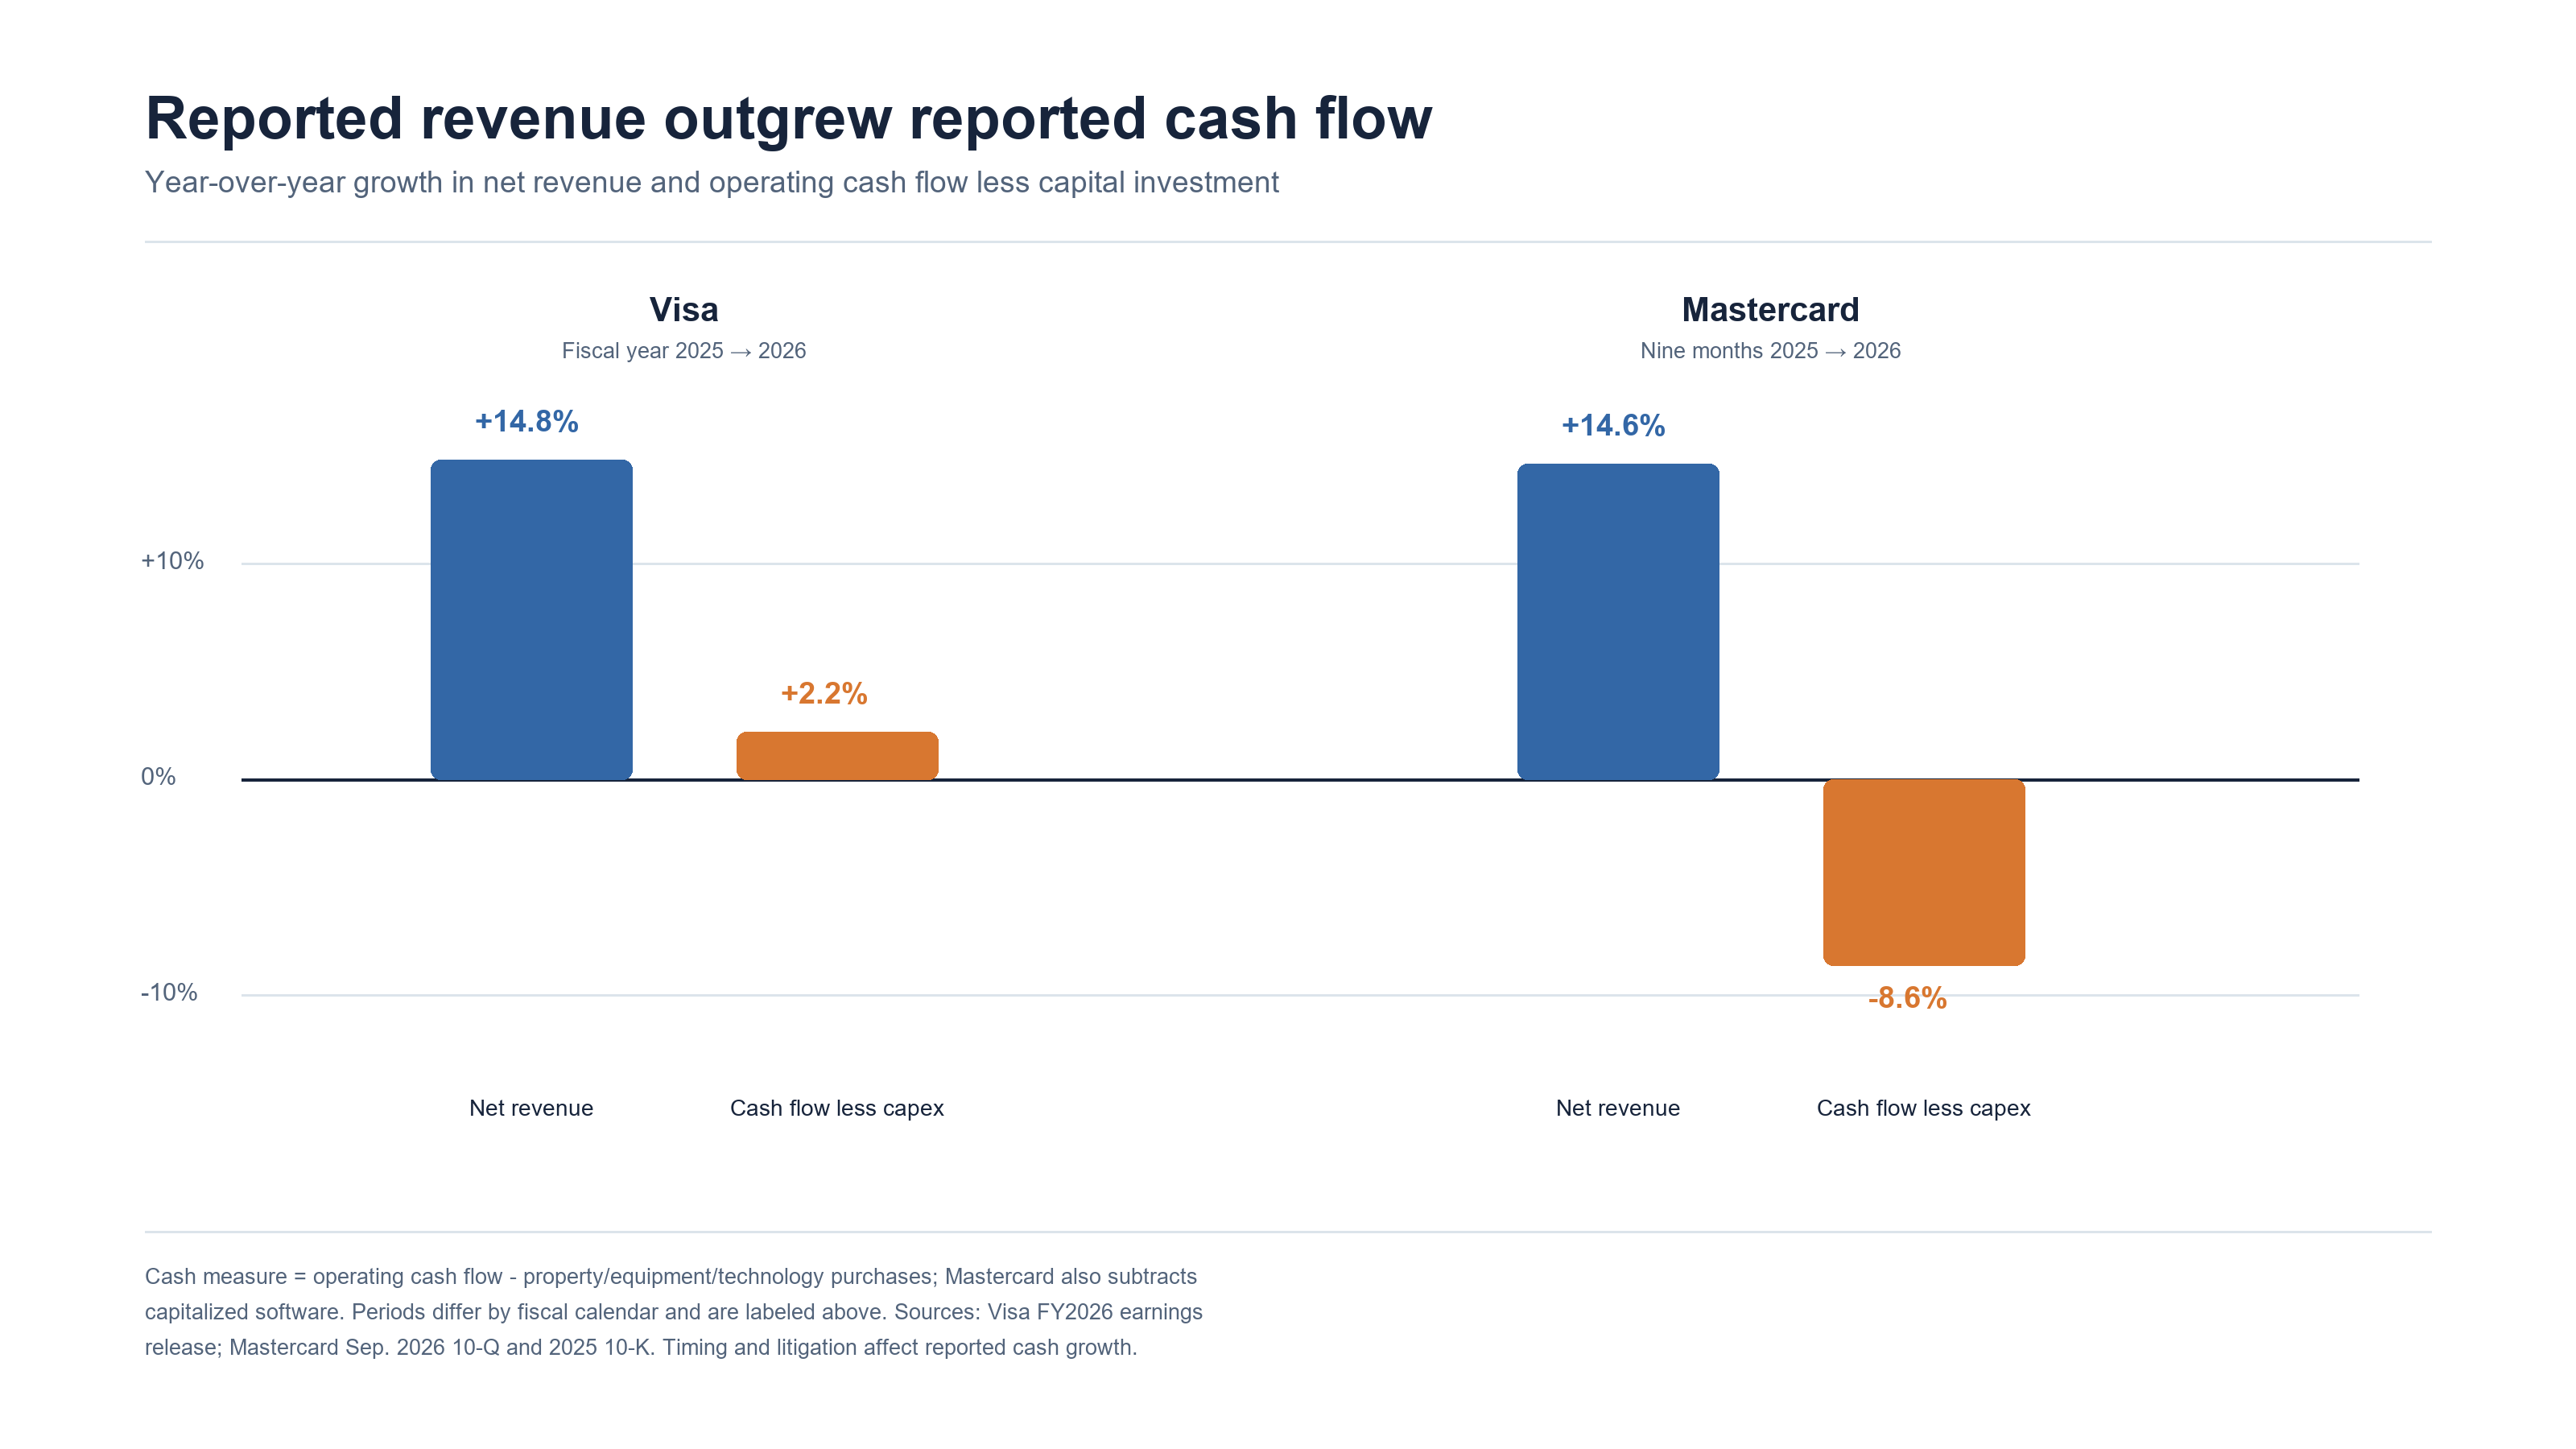
Figure 1. Visa compares fiscal 2026 with fiscal 2025; Mastercard compares the first nine months of each calendar year. Calculations use the cash-flow definition above and nominal U.S. dollars. Litigation payments, customer incentives and settlement timing affect reported cash growth; these bars do not establish a change in underlying earning power.
How the same multiple was reached
For Visa, divide each November 4 closing share price by the GAAP diluted Class A EPS from its fiscal year just reported. The result moves from about 30.0 times in 2024 to 33.4 times in 2025 and 35.4 times in 2026.
For Mastercard, construct a trailing EPS proxy from the last published full year, adding the current nine-month EPS and subtracting the previous nine-month EPS. That yields about 38.2, 35.3 and 35.2 times on the same three dates.
Three annual observations are a useful comparison, not a historical valuation distribution or an estimate of a normal multiple.
Sources: Visa 2024, 2025, 2026; Mastercard 2023, 2024, 2025, 2026.
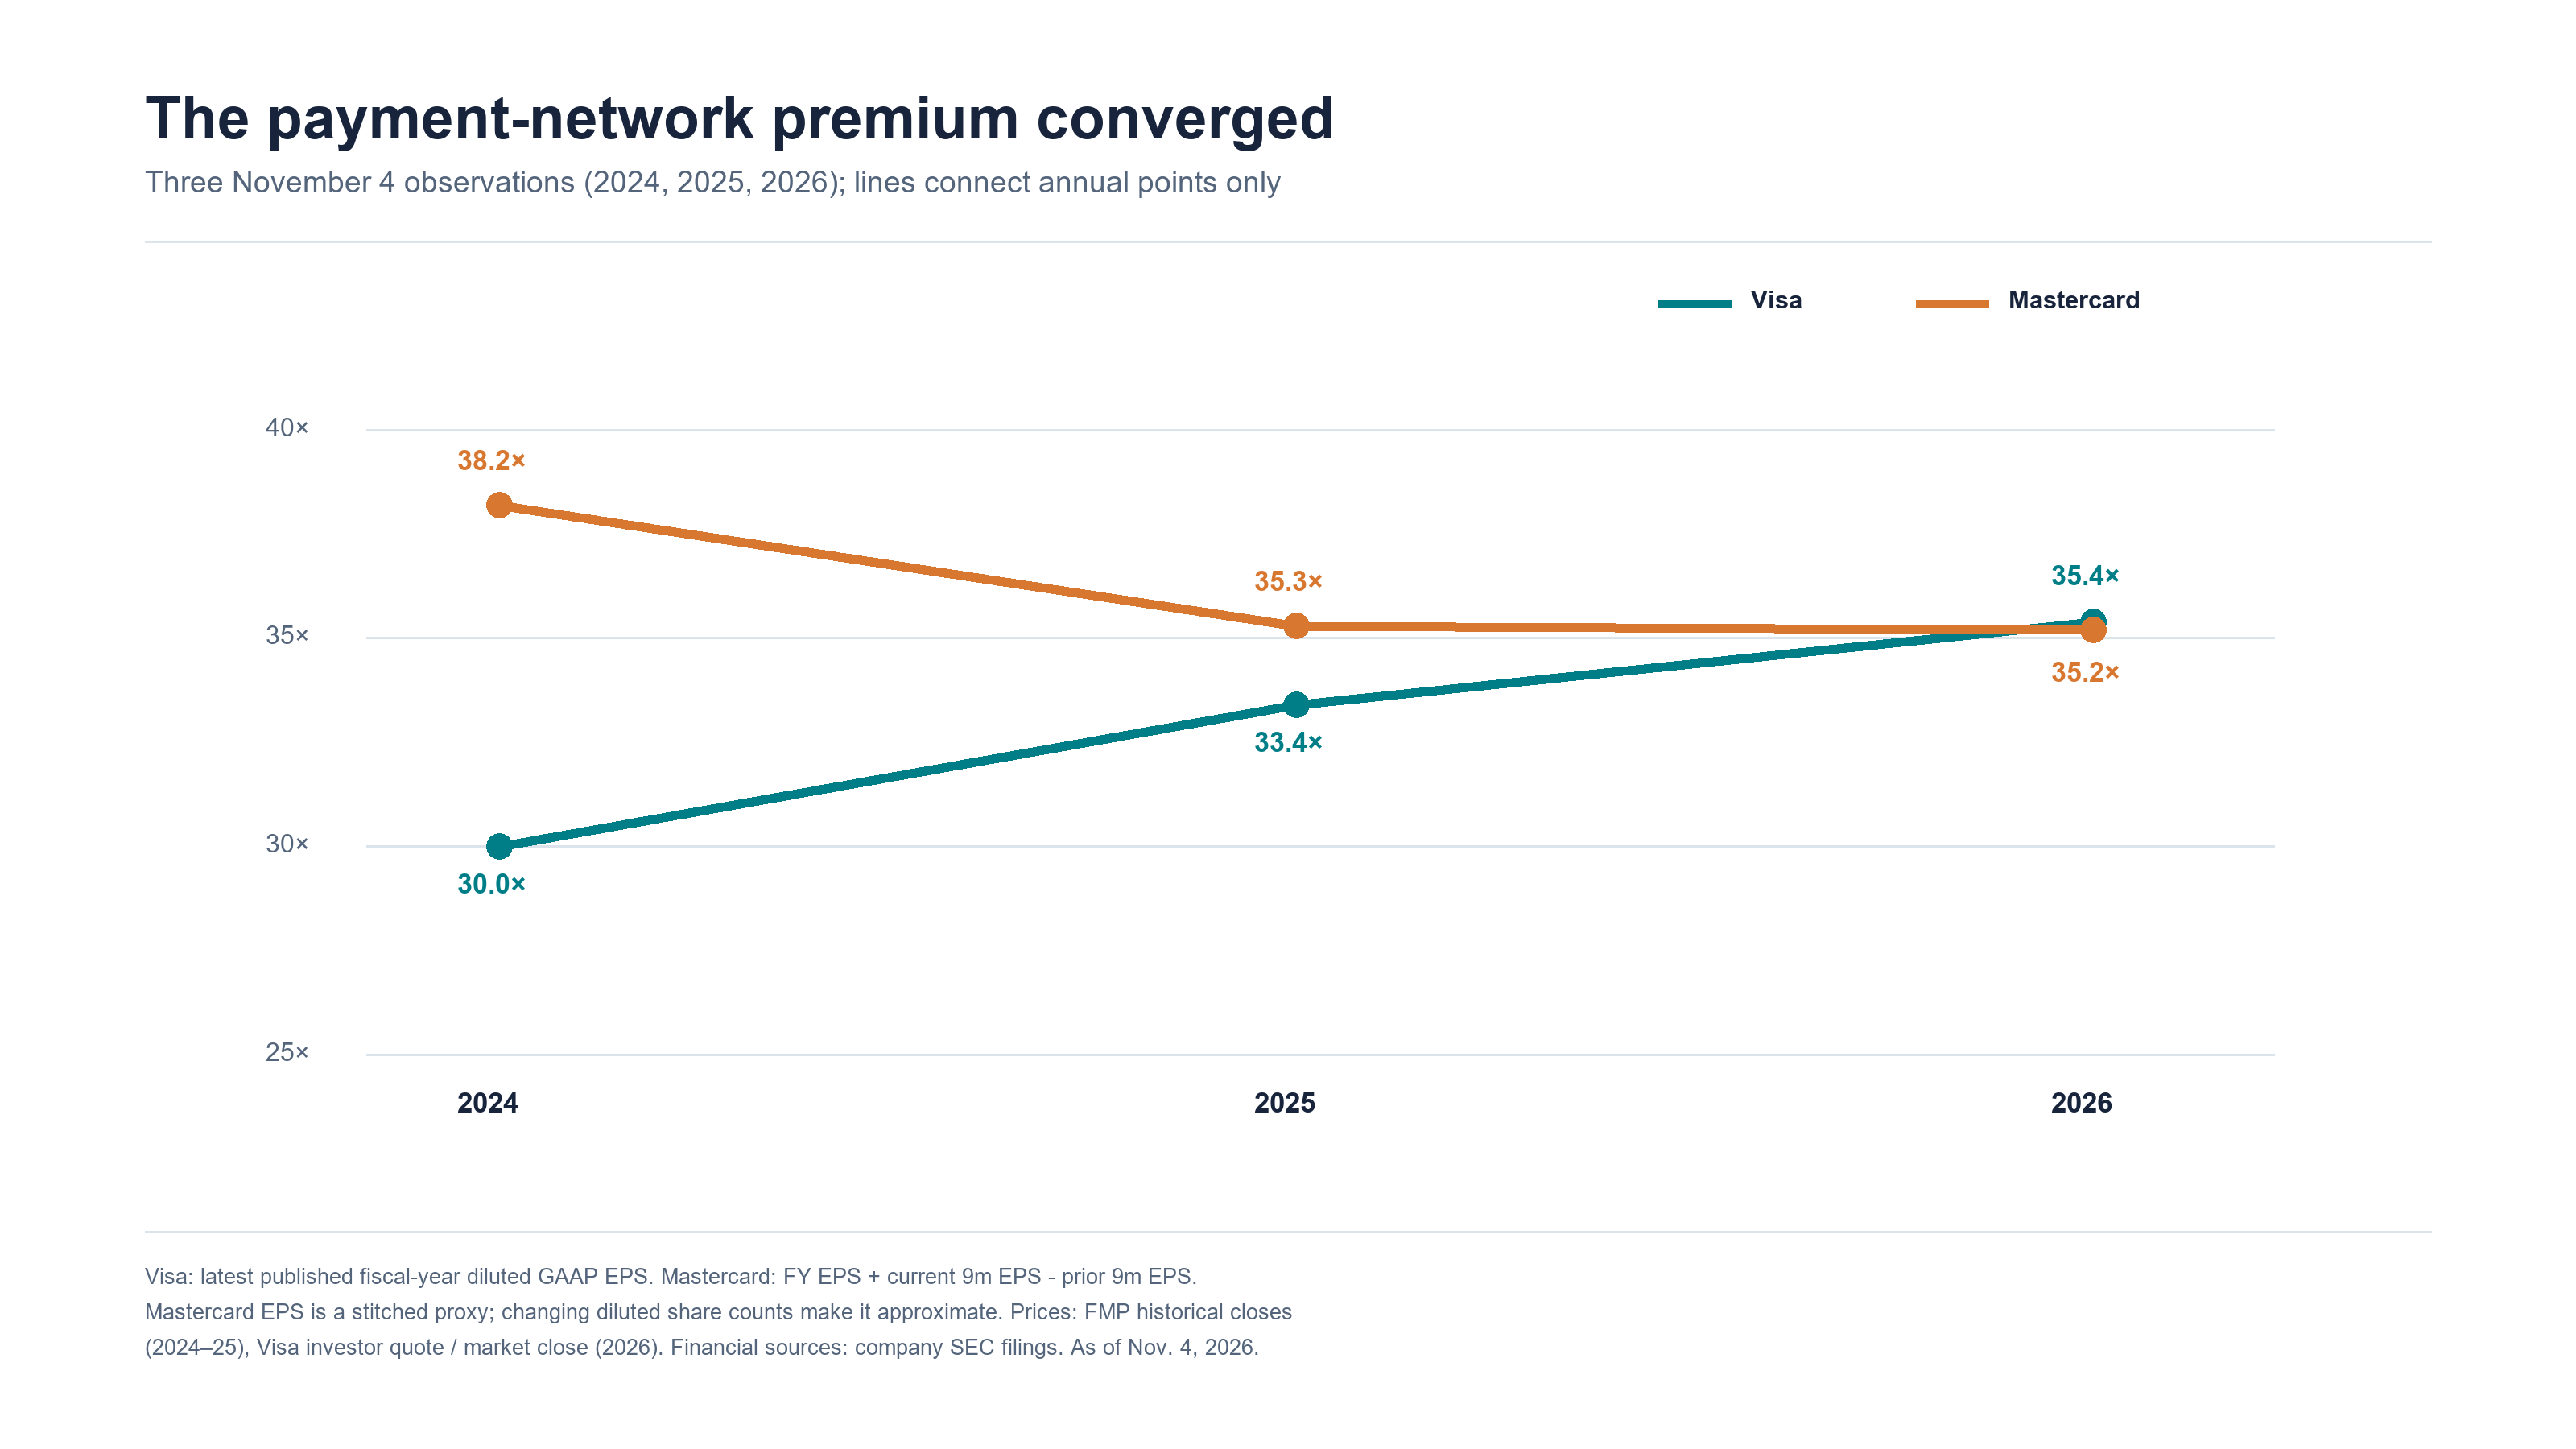
Figure 2. Three annual observations, connected for readability; the lines do not represent a continuous valuation series. The Mastercard EPS denominator is an approximate stitched measure because diluted share counts change. Closing prices come from the author's historical FMP series for 2024-25 and November 4 market quotes for 2026; financial data come from the company filings linked above.
The change in multiples alters how the past two years read.
Visa's November 4 share price rose approximately 50% between 2024 and 2026, while its published annual GAAP EPS rose approximately 27%. A rising multiple accounts for part of the price gain.
Mastercard's price rose approximately 33% while its stitched trailing EPS proxy rose approximately 44%. A falling multiple absorbed part of that earnings increase.
This decomposition is arithmetic, not an explanation of investors' motives. It also says nothing about dividends or the return earned by buying at some other date.
At the November 4 headline multiple, Visa has the higher observed operating and cash margins; Mastercard has a services line that grew 20% in the first nine months and a lower multiple relative to its own 2024 observation.
Those facts do not demonstrate that Mastercard is undervalued or Visa overvalued. They identify different hurdles.
For Visa, the test is whether transaction and cross-border growth, margins and cash generation remain strong enough to support a multiple that has expanded on these three dates. Slower volume or weaker margins would make that higher multiple harder to defend.
For Mastercard, the test is whether services growth adds profitable, repeatable cash after the incentives required to win and retain customers. Persistent incentive pressure or weak cash conversion beyond the current settlement period would weaken that case.
Both stocks face multiple risk; the evidence that would change my view differs.
What the price asks investors to assume
A per-share earnings sensitivity shows the pricing hurdle, but it is not a cash-flow model.
Starting at 35.3 times earnings, assume EPS grows 12% annually for five years and the exit multiple is 25 times. The implied price change is about +25% over five years, before dividends:
(1.12)^5 × 25 / 35.3 − 1
At 8% annual EPS growth, the same exercise gives about +4%; at 16%, about +49%.
None is a forecast, target price or estimated fair value.
Repurchases may lift EPS without equivalent growth in total earnings, while dividends are omitted from this price-only calculation. For the EPS scenario to represent durable value creation, investors would also need sustained cash generation after incentives, litigation and capital investment.
The sensitivity also exposes the risk in treating quality as a substitute for price. If a high multiple remains intact, respectable earnings growth can reward shareholders. If it contracts, good operating results may produce a modest share-price gain.
Future reports can help test the assumptions: transaction and cross-border trends, the profitability of Mastercard's services mix, customer incentives, capital spending and operating cash flow over several periods all matter more than a single quarter's EPS surprise.
Legal and customer economics add uncertainty. Visa recorded a $1.7 billion litigation provision in fiscal 2026. Mastercard reported litigation charges in the first nine months of 2026 and said payment-network rebates and incentives rose 21% in that period.
Those are company-specific reported items, not reasons to assume identical future outcomes. They are reminders that a payment network's impressive margin must be assessed alongside the costs of maintaining that network and defending its economics.
Sources: Visa release; Mastercard filing.
I would not turn this comparison into an automatic buy call for either stock.
Both businesses have demonstrated strong margins and substantial cash production.
The more revealing observation is that the gap between their earnings multiples has nearly vanished while reported cash growth has recently lagged revenue growth at both companies, partly for identifiable timing and litigation reasons.
An investor paying roughly 35 times earnings should be willing to state which company's next several years of earnings and cash conversion justify that price, and what evidence would change that judgment.
Comments
Log in or sign up to join the conversation.