

Written by Erik Lytikainen and Rob McBride
The S&P 500 (SPX) reached all-time highs again on Friday, and the gamma flip level at the end of the week rose to 4,650. As long as we remain above this level, this model will maintain a 100% allocation to SPX. Monthly option expiration days are shown below by the vertical dashed lines.

Photo by Yiorgos Ntrahas on Unsplash
The Gamma Band model is a simplified trend following model that is designed to show the effectiveness of tracking various “gamma” levels. This can be viewed conceptually as a risk management tool. When the daily price closes below Gamma Flip level, the model will reduce exposure to avoid price volatility and sell-off risk. If the market closes below what we call the “lower gamma level” (currently near 4,460), the model will reduce the SPX allocation to zero.
The main premise of this model is to maintain high allocations to stocks when risk and corresponding volatility are expected to be low. For investors who have been conditioned to “buy low and sell high,” it is counter-intuitive to increase allocations when the market rises, but this approach has shown to increase risk-adjusted returns in the back-test.
(Click on image to enlarge)
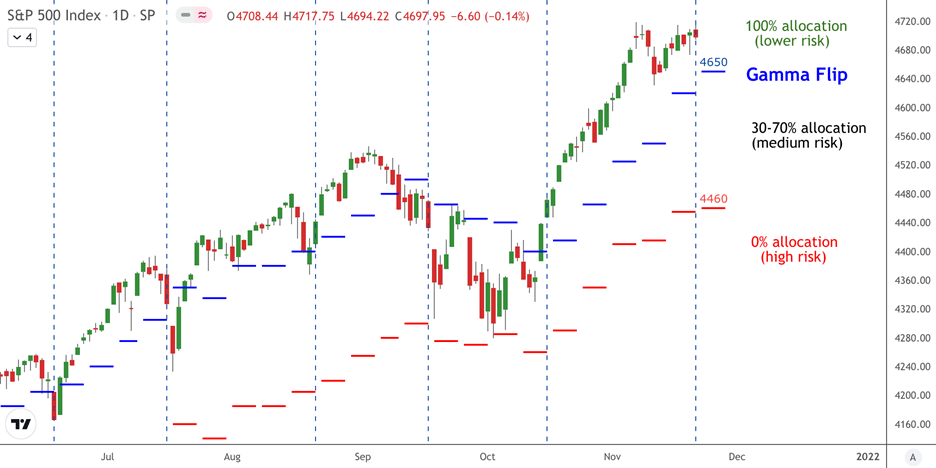
The Gamma Band model is one of several indicators that we publish daily in our SPX Report.
With stocks climbing to historically high valuations, risk management tools have become more important than ever to manage the next big drawdown. We incorporate many options-based signals into our daily stock market algorithms.
The Gamma Flip – Background
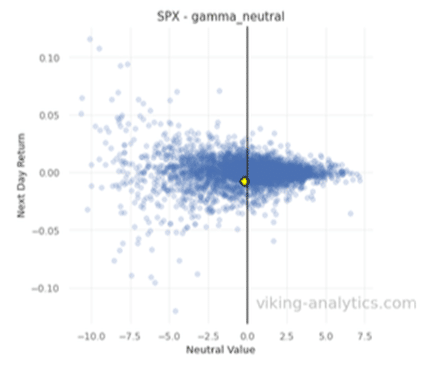
Many market analysts have noted that daily volatility in the S&P 500 will change when the value of the SPX moves from one gamma regime to another. Some analysts call this level the “gamma flip.” The scatterplot below shows how price volatility (on the y-axis) is increasingly lower as the value of SPX rises higher above the Gamma Neutral level (on the right side of the chart). When the value of the S&P closes lower than Gamma Neutral (to the left of the chart), volatility increases.
Gamma Band Model – Background
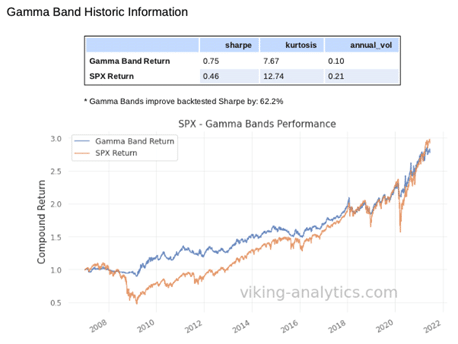
The purpose of the Gamma Band model is to show how tail risk can be reduced by following a few simple rules. The daily Gamma Band model has improved risk-adjusted returns by over 60% since 2007. The graph below demonstrates how this approach can limit drawdowns while maintaining good returns.



Comments
Log in or sign up to join the conversation.