

Hello everyone. In today’s article, we will look at the past performance of the 1H Hour Elliott Wave chart of VanEck Gold Miners ETF ($GDX). The rally from 10.04.2023 low unfolded as a 5 wave impulse. So, we expected the pullback to unfold in 3 swings and find buyers again. We will explain the structure & forecast below:
$GDX 1H Elliott Wave Chart 10.26.2023:
(Click on image to enlarge)
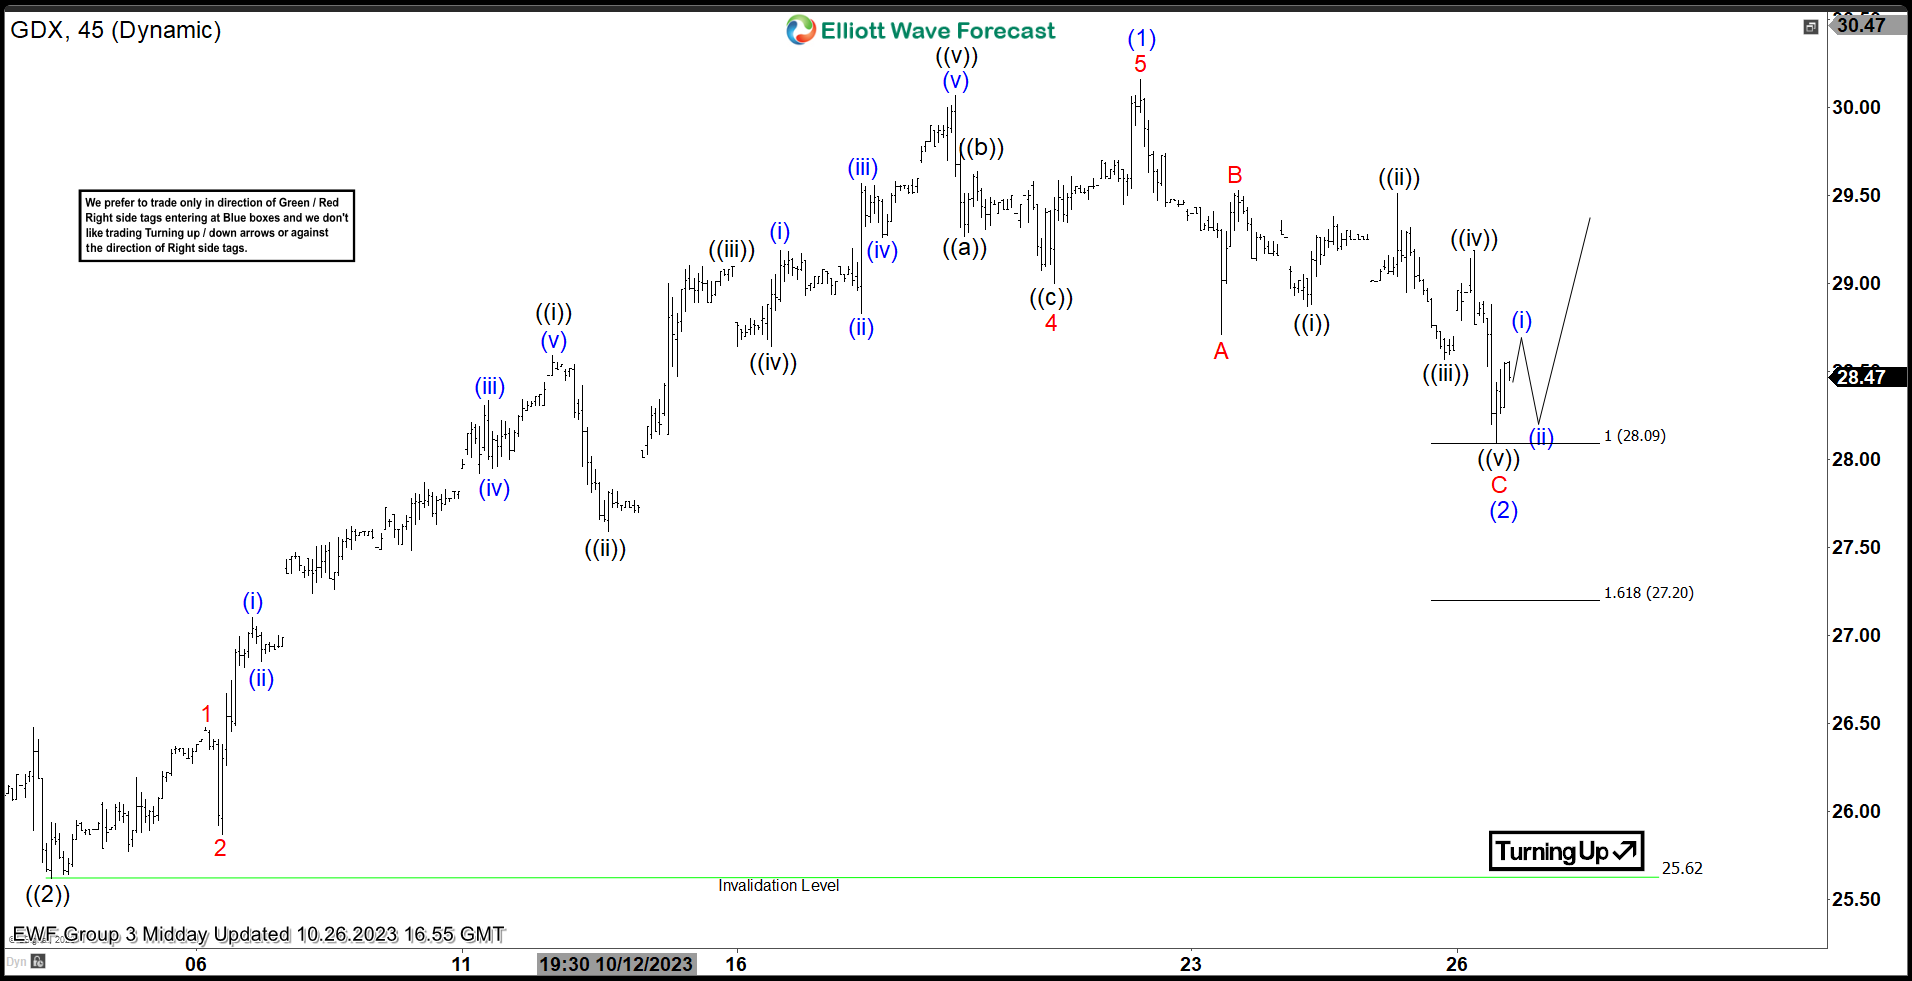
Here is the 1H Elliott Wave count from 10.26.2023. The rally from 10.04.2023 peaked at blue (1) $30.16 and started a pullback to correct it. We expected the pullback to find buyers at (2) in 3 swings (ABC) at $28.09 – 27.20.
$GDX 1H Elliott Wave Chart 10.29.2023:
(Click on image to enlarge)
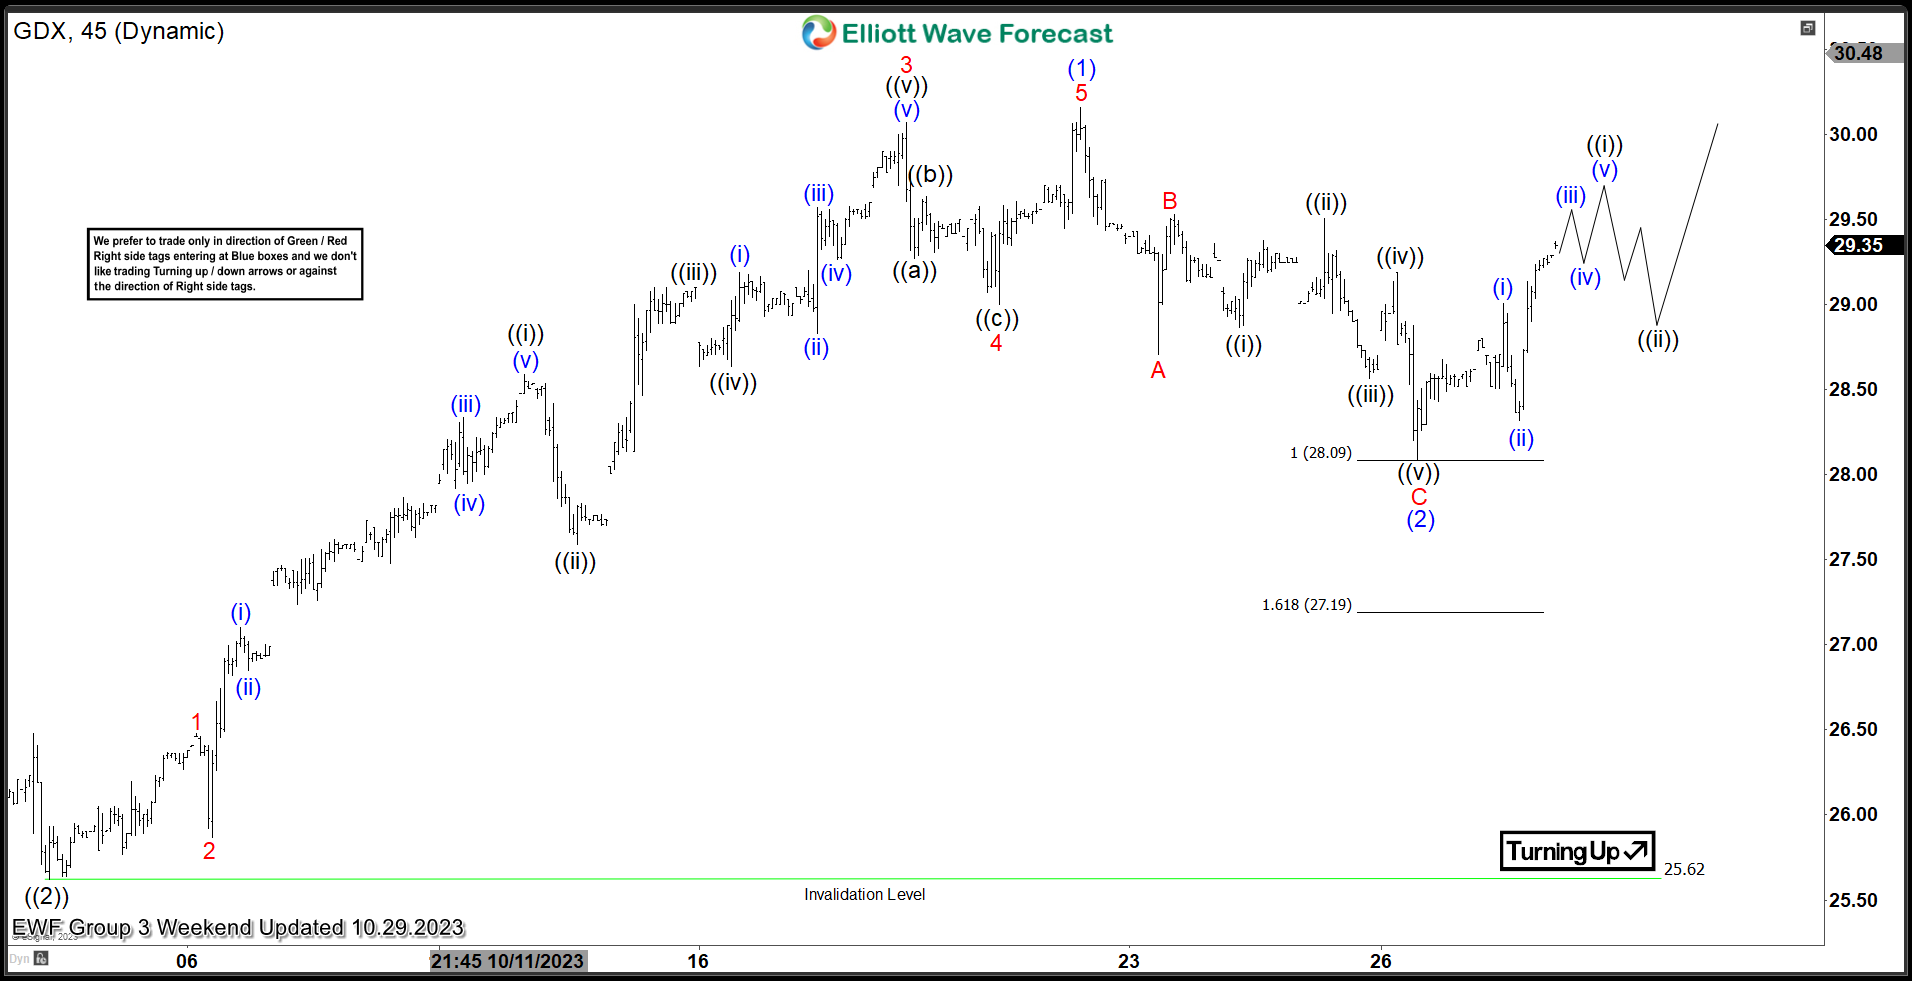
Here is the 1H update from 10.29.2023 showing the bounce taking place as expected. The ETF reacted higher after reaching the equal legs area allowing longs to get a risk free position. We expect the ETF to continue higher in wave (3) towards 32.65 – 35.47 before a pullback can happen. Alternatively, if the ETF is unable to break above $30.16 at blue (1) then a double correction lower can happen (WXY) before higher.
More By This Author:
Silver Found Buyers After Elliott Wave Double Three PatternRussell 2000 Soon Will Open Bearish Sequence
EURUSD: Catching The 130 PIP 1:10 Risk/Reward Move Higher



Comments
Log in or sign up to join the conversation.