

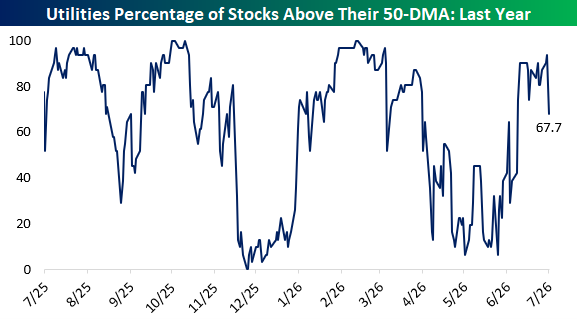
The Utilities sector of the S&P 500 slid 0.98% yesterday, making it the index’s worst-performing sector. Just 5 of 31 member stocks finished higher as the percentage of stocks trading above their 50-DMAs sank from 93.5% to 67.7%, a one-day drop of 25.8 percentage points.
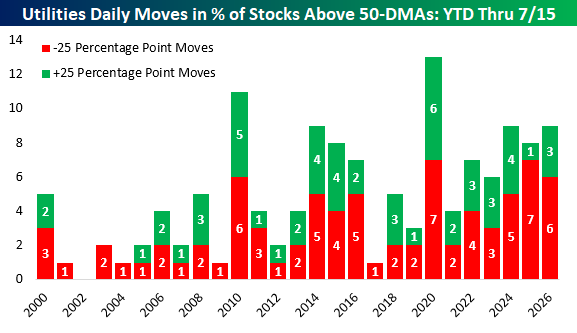
Through July 15th, the Utilities sector has recorded 6 one-day declines of at least 25 percentage points in the percentage of stocks above their 50-DMAs this year. That ties 2010 for the second-most such declines on record through this point last year. Only 2020 and 2025 had more, with 7 days each.
In contrast, swings of the same magnitude in the other direction have occurred just 3 times so far this year. Since the turn of the century, the Utilities sector has averaged two daily improvements and three daily declines of at least 25 percentage points YTD through July 15th. In other words, although sharp breadth improvements have been more common than usual this year, they have still been outnumbered two to one by equally sharp deteriorations, which have been nearly as common as ever.
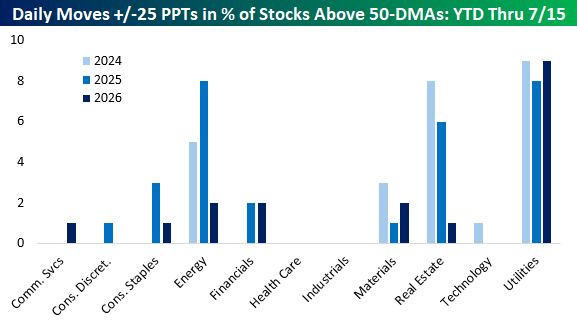
This type of breadth volatility has become a defining feature of Utilities in recent years since the AI boom. In each of the last three years, the sector has either led or tied all other S&P 500 sectors in the number of daily moves of at least 25 percentage points in either direction through July 15th. Energy tied Utilities with eight such moves last year, but no other sector has matched it over that span.
Most sectors outside of Utilities, Energy, Real Estate, and Materials have had at least one year since 2024 with no moves of that magnitude through July 15th. Health Care and Industrials have had none in any of the last three years, compared with 26 combined for Utilities. One partial driver for the high and low frequency of moves among sectors is the number of components in each. Utilities, Energy, and Real Estate all rank in the bottom five in terms of the number of components in each sector.

Comments
Log in or sign up to join the conversation.