
(Click on image to enlarge)

In the long term, USOIL could form a triple zigzag Ⓦ-Ⓧ-Ⓨ-Ⓧ-Ⓩ. The primary waves Ⓦ-Ⓧ-Ⓨ seem fully completed.
Since December 2022, the market has been moving in an upward primary wave Ⓧ. Perhaps it takes the form of an intermediate double zigzag (W)-(X)-(Y). Now prices are moving higher in the final actionary wave (Y).
The wave (Y) will likely end near 90.44, taking the form of a zigzag A-B-C. At that level, wave Ⓧ will be at 38.2% of wave Ⓨ.
(Click on image to enlarge)
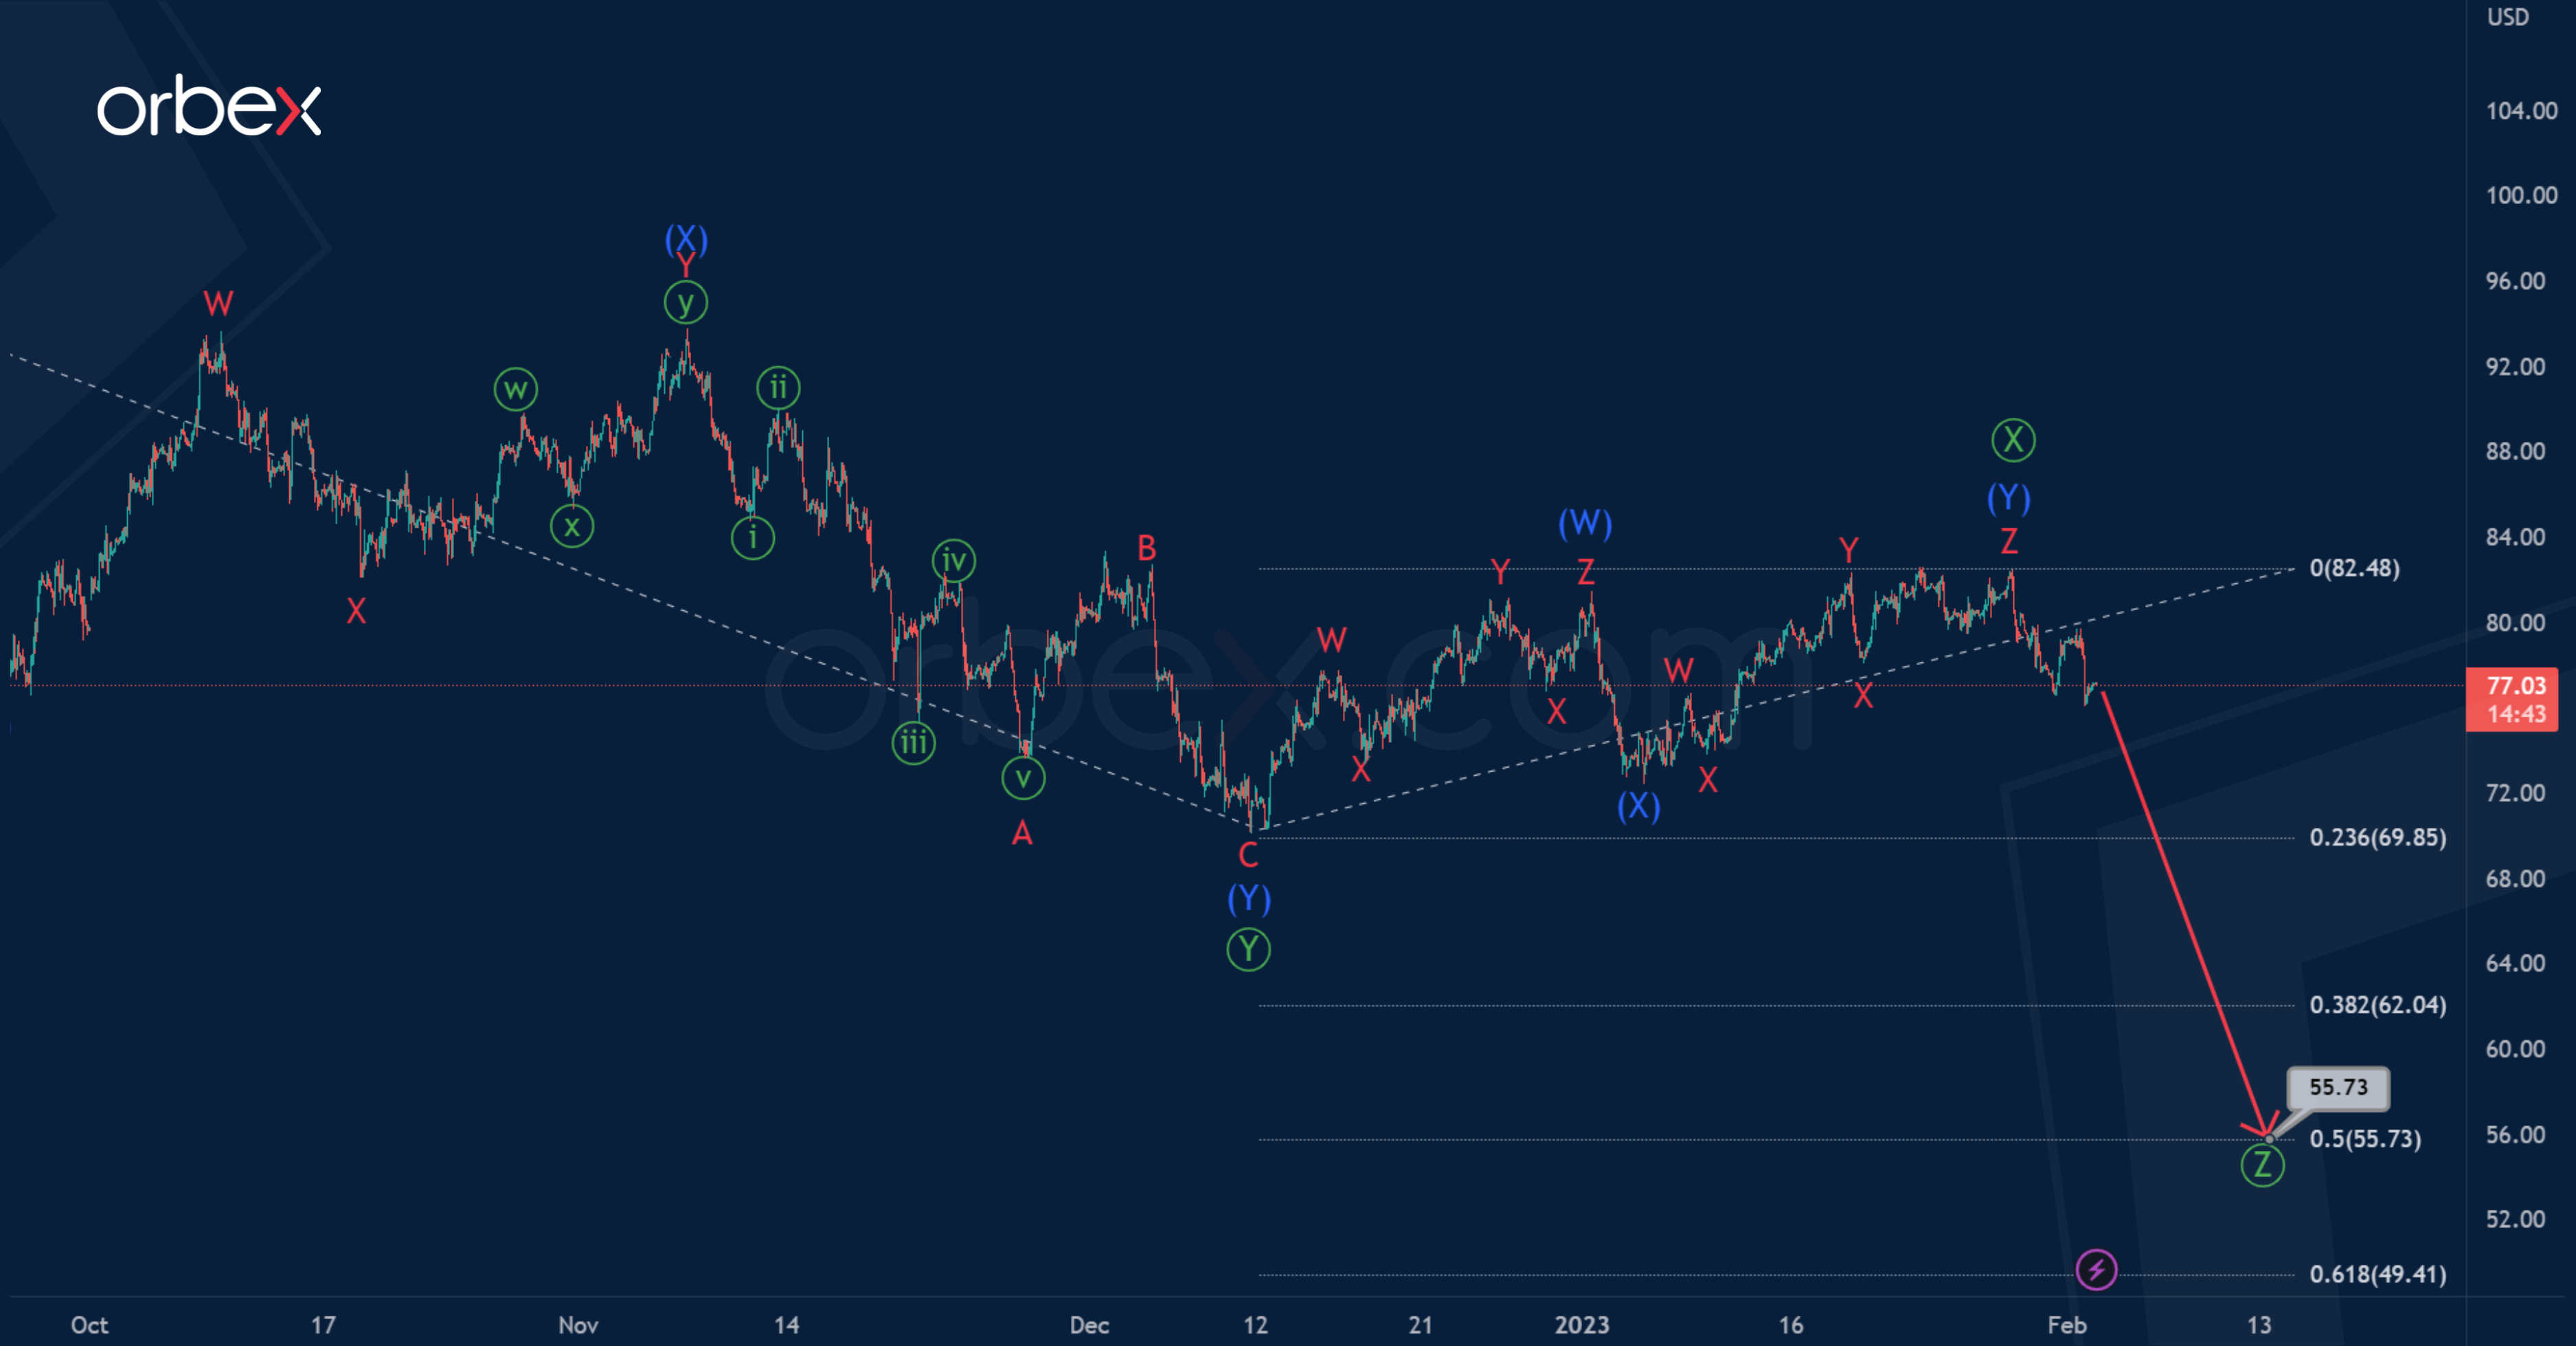
There is a possibility that the intervening wave Ⓧ has already been completed at the previous maximum of 81.70.
Most likely, now and in the near future, we will observe a decline and the development of the primary actionary wave Ⓩ.
The bearish trend will likely continue to 55.73. At that level, primary wave Ⓩ will be at 50% of wave Ⓨ
More By This Author:
Intraday Analysis – USD Under Renewed Pressure
ECB To Raise Rates, But Maybe Not As Much As Expected
USDCNH: Triple Or Double Zigzag?


Comments
Log in or sign up to join the conversation.