
USDCNH: Triple Or Double Zigzag?
(Click on image to enlarge)

USDCNH seems to be forming a double zigzag of the cycle degree w-x-y.
The first large wave w is completed as a standard zigzag. The bearish intervening wave x could also be fully constructed. At the moment it looks completed as a double zigzag of the primary degree Ⓦ-Ⓧ-Ⓨ.
In the near future, prices could move higher in the actionary wave y. Perhaps it will take the form of a standard zigzag Ⓐ-Ⓑ-Ⓒ.
Most likely, we will see the end of the first primary wave Ⓐ at the maximum of 7.00, or a little higher.
(Click on image to enlarge)
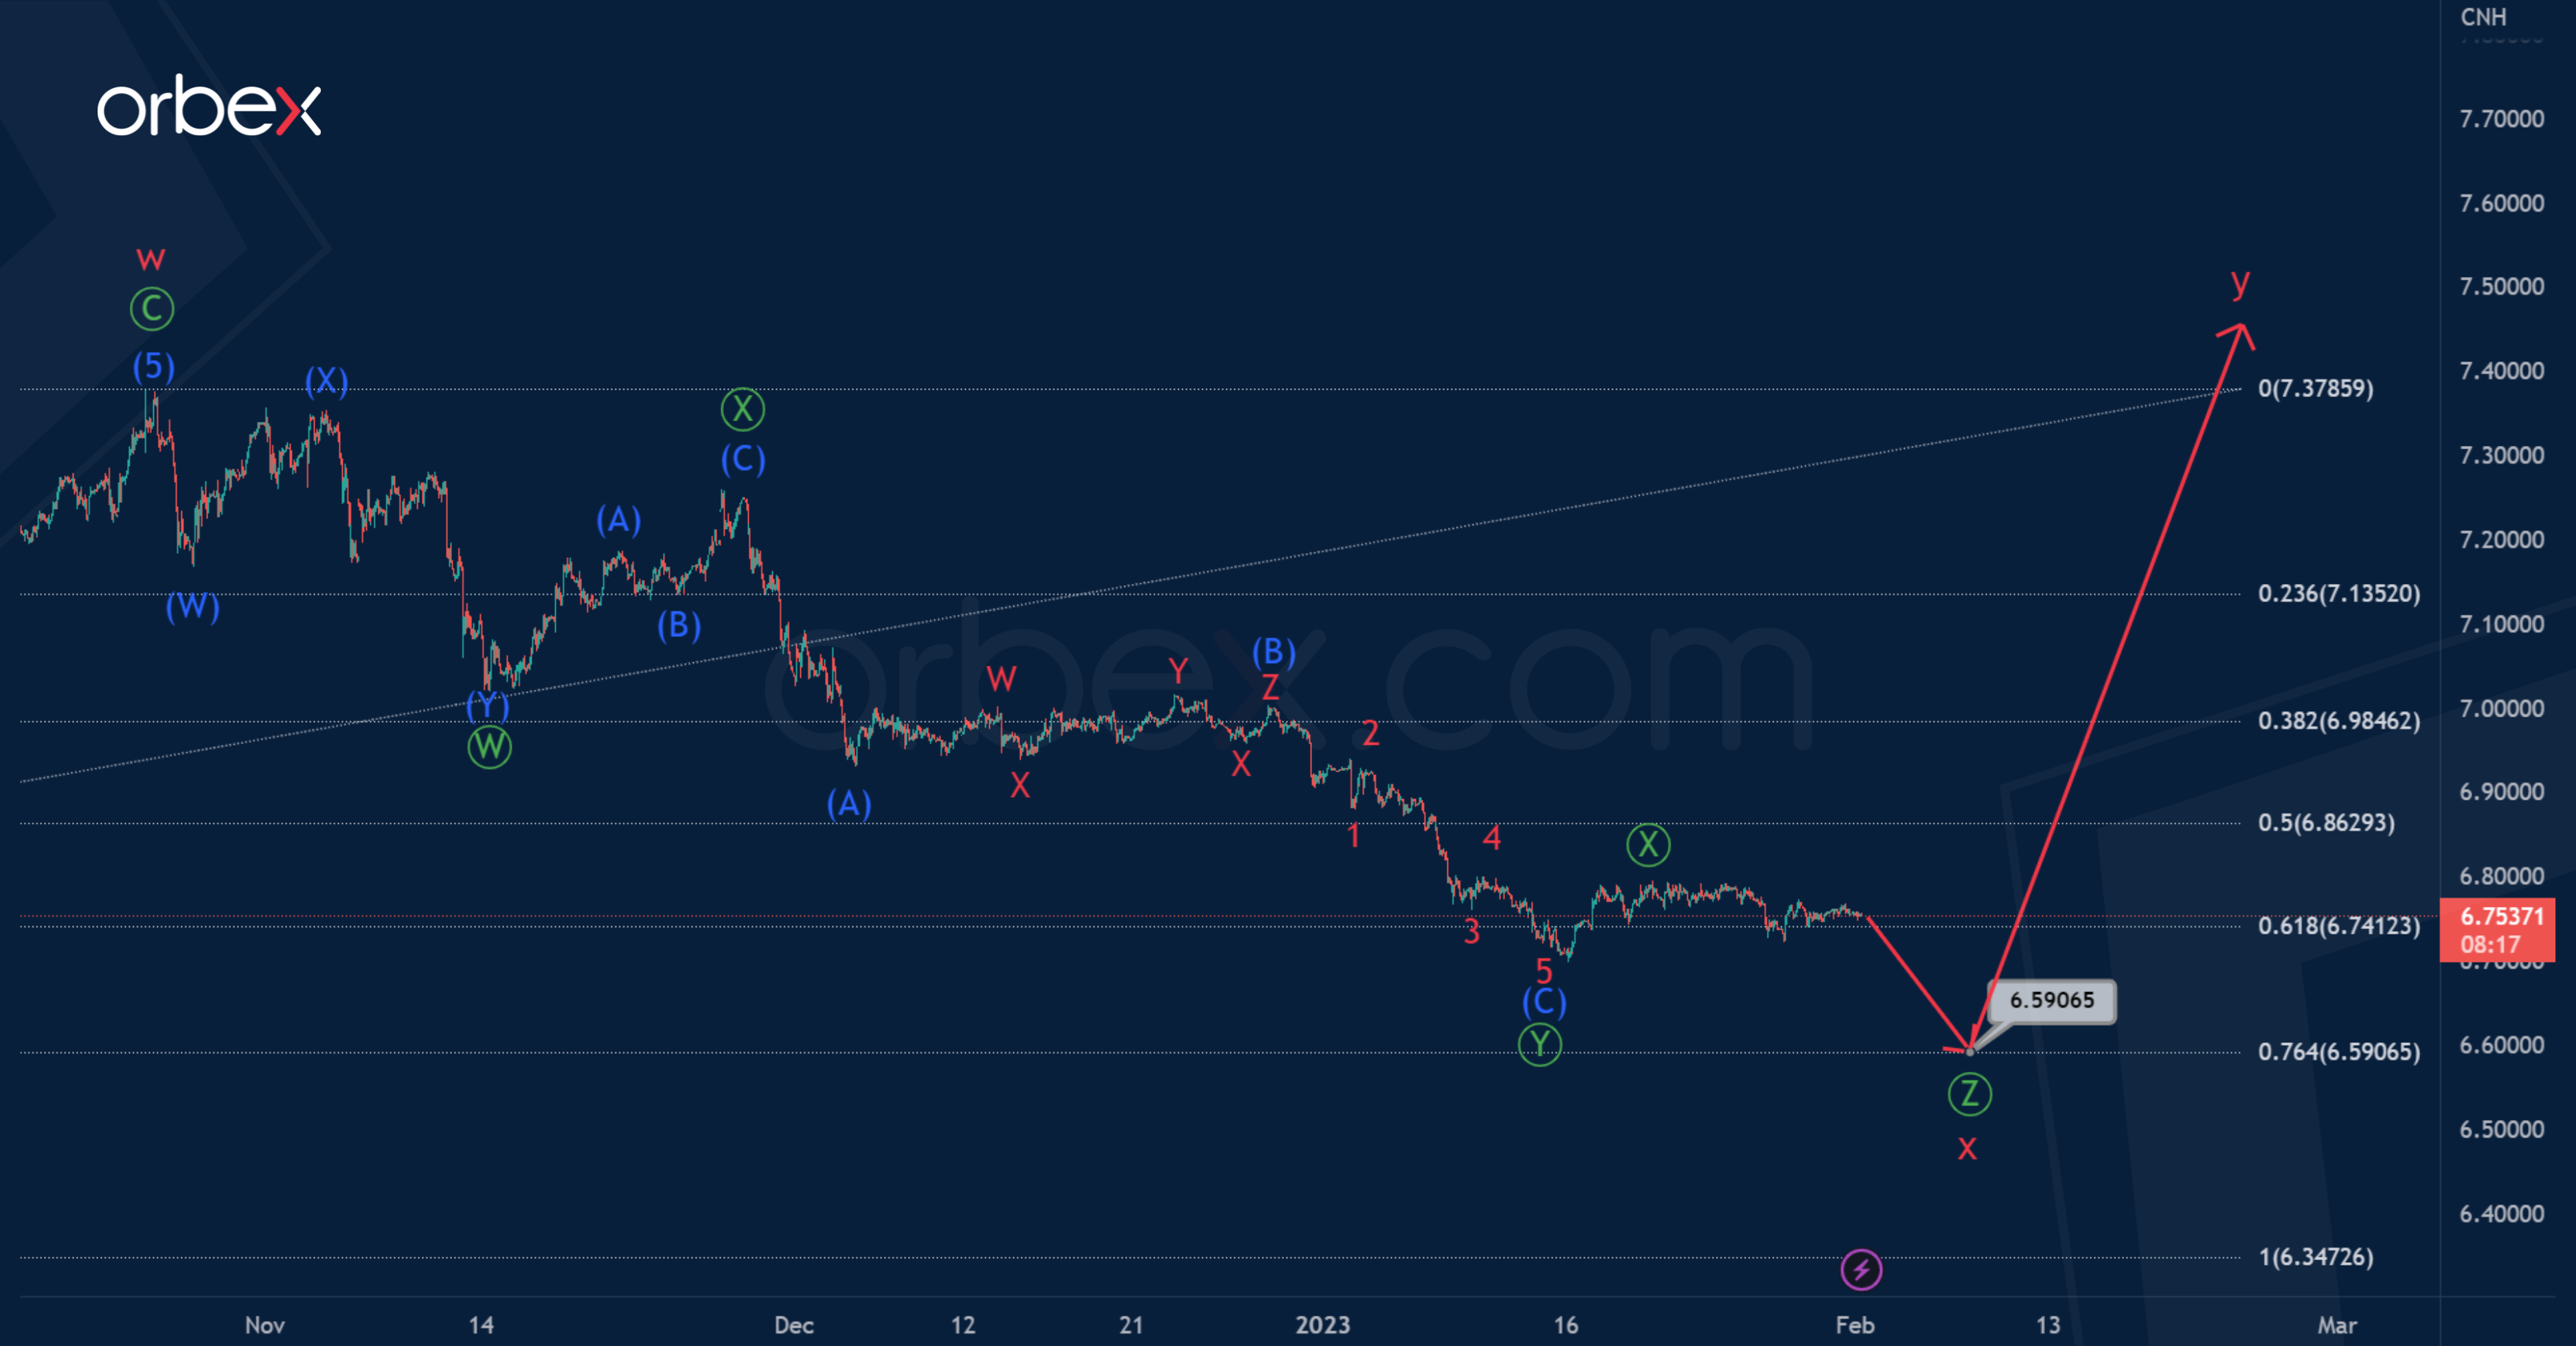
In the second scenario, the price could move in a downtrend. The cycle intervening wave x is not yet complete. Most likely, it will take the form of a triple zigzag Ⓦ-Ⓧ-Ⓨ-Ⓧ-Ⓩ and not a double.
If the actionary wave Ⓨ ends, then a slight increase in the second intervening wave Ⓧ is likely. After which the fall can be continued in the final primary wave Ⓩ.
The approximate level of market decline is 6.590. It is defined using Fibonacci lines. At that level, wave x will be at 76.4% of wave w
More By This Author:
USDCAD Final Leg Of Triple Zigzag Begins
Intraday Analysis – USD In Consolidation Mode
BoE Expected To Hike Again This Week
Disclaimer: Orbex LIMITED is a fully licensed and Regulated Cyprus Investment Firm (CIF) governed and supervised by the Cyprus Securities and Exchange Commission (CySEC) (License Number ...
more

