

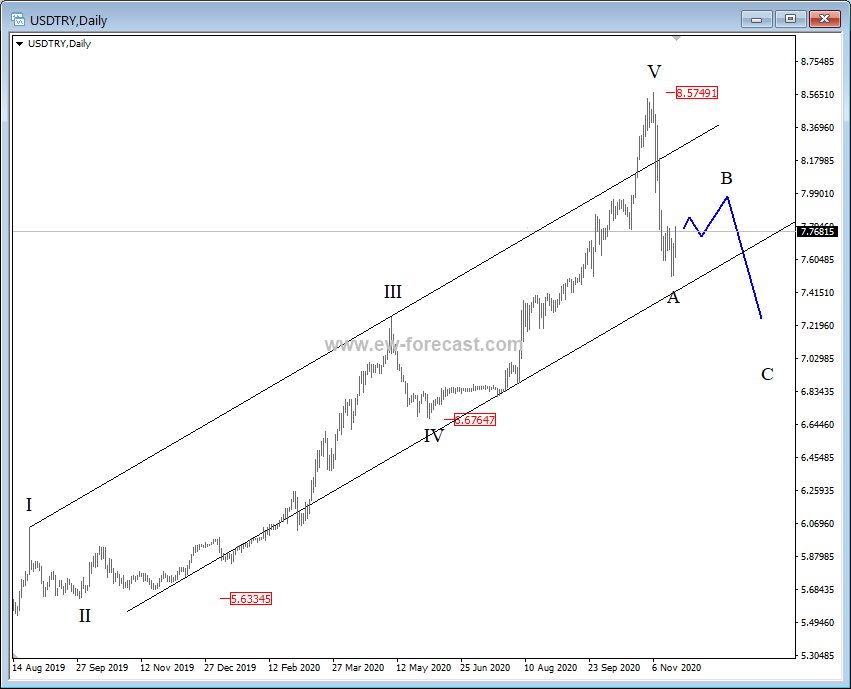
USD/TRY made a five-wave recovery as seen on the daily chart, up from August of 2019. We know that after a five-wave move, a temporary three-wave pullback must follow. In our case, this already seems to be the case, as price made a sharp, and impulsive decline from the 8.57 high. This decline can be part of an A-B-C move, which can in weeks and months ahead target the 7.0/6.8 region.
USD/TRY, daily
On the lower degree time frame chart of the USD/TRY, we have a better look at the wave structure, down from 8.577 level. We labeled a five-wave move in wave A, which looks to have found support at the 7.5 level, as the price started to rise sharply, and it also broke above the upper Elliott wave channel line, which calls for a low in place for wave A, and for a three-wave correction within a wave B.
USD/TRY, 4h
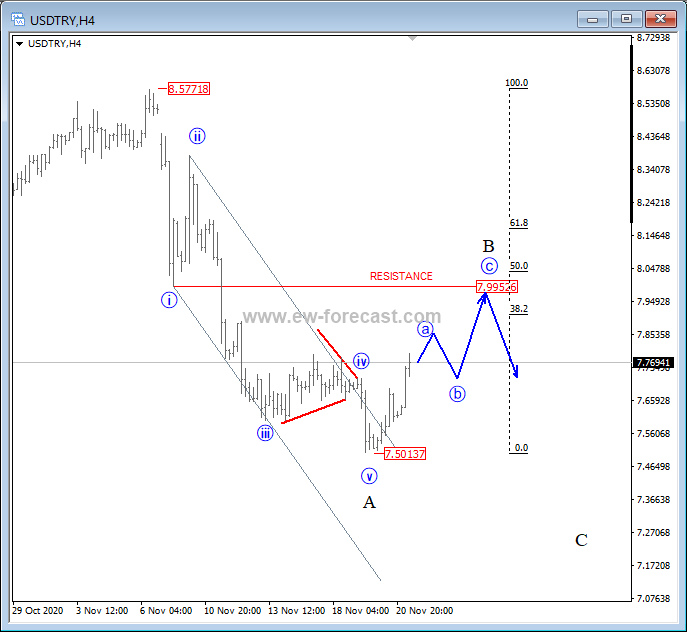
Once wave B fully develops its correction, ideally around the 7.99 area, that is when a new impulse as wave C may start forming.



Comments
Log in or sign up to join the conversation.