

Image Source: Pixabay
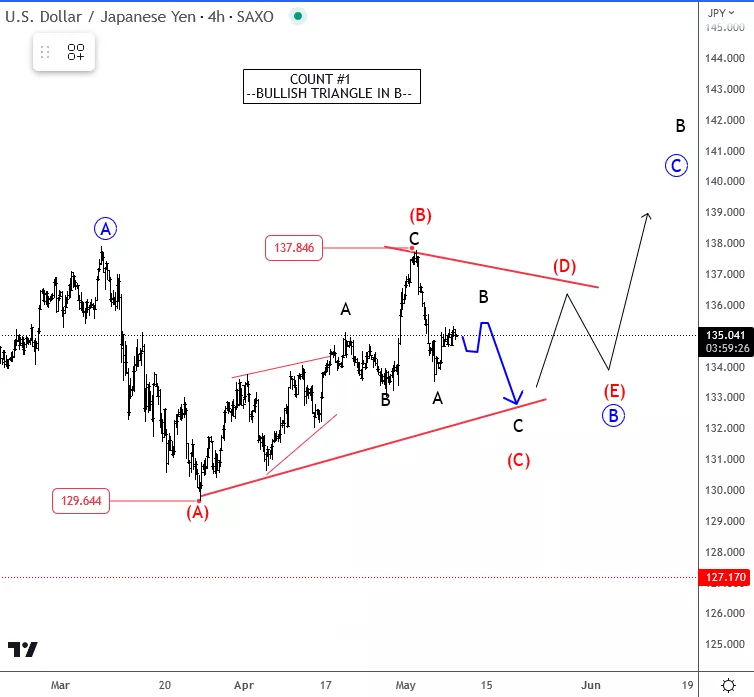
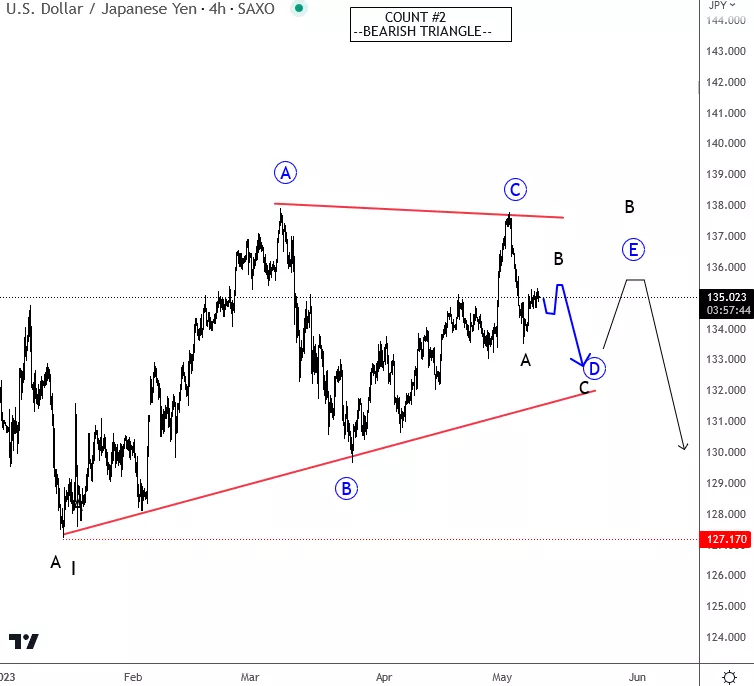
USDJPY made a sharp reversal in 2022 on a daily chart and touched the 126-130 area after the BoJ policy YCC adjustment back in December. However that drop appears completed as we have seen a rally in the 4h chart, but it's just another corrective recovery that is still in progress now. With the current drop without reaching March highs, seems like correction is getting more complex, so we are observing two counts at this stage. As a primary count, we are tracking a bullish triangle pattern in wave B that can later send the price higher for wave C to complete a higher degree wave B/II correction near 141. But, keep also an eye on the second count, where the triangle can be also a bearish one within wave B. However, in both cases, we can expect more sideways price action, but shorter-term both counts suggest at least temporary weakness down to around the 132 area (blue arrows).
More By This Author:
Crude Oil Is Nearing Temporary Support
Cryptos Turn South For A Deeper Correction
Bitcoin Is Trading In A Higher Degree Correction


Comments
Log in or sign up to join the conversation.