

USDJPY extended the rally this week and exceeded the peak seen on 20th May 2020. In this article, we would look at the forecast from start of the week and how we called it higher. We will show some charts presented to clients this week and explain the reason for calling the extension higher and also talk about what we are expecting next in the pair.
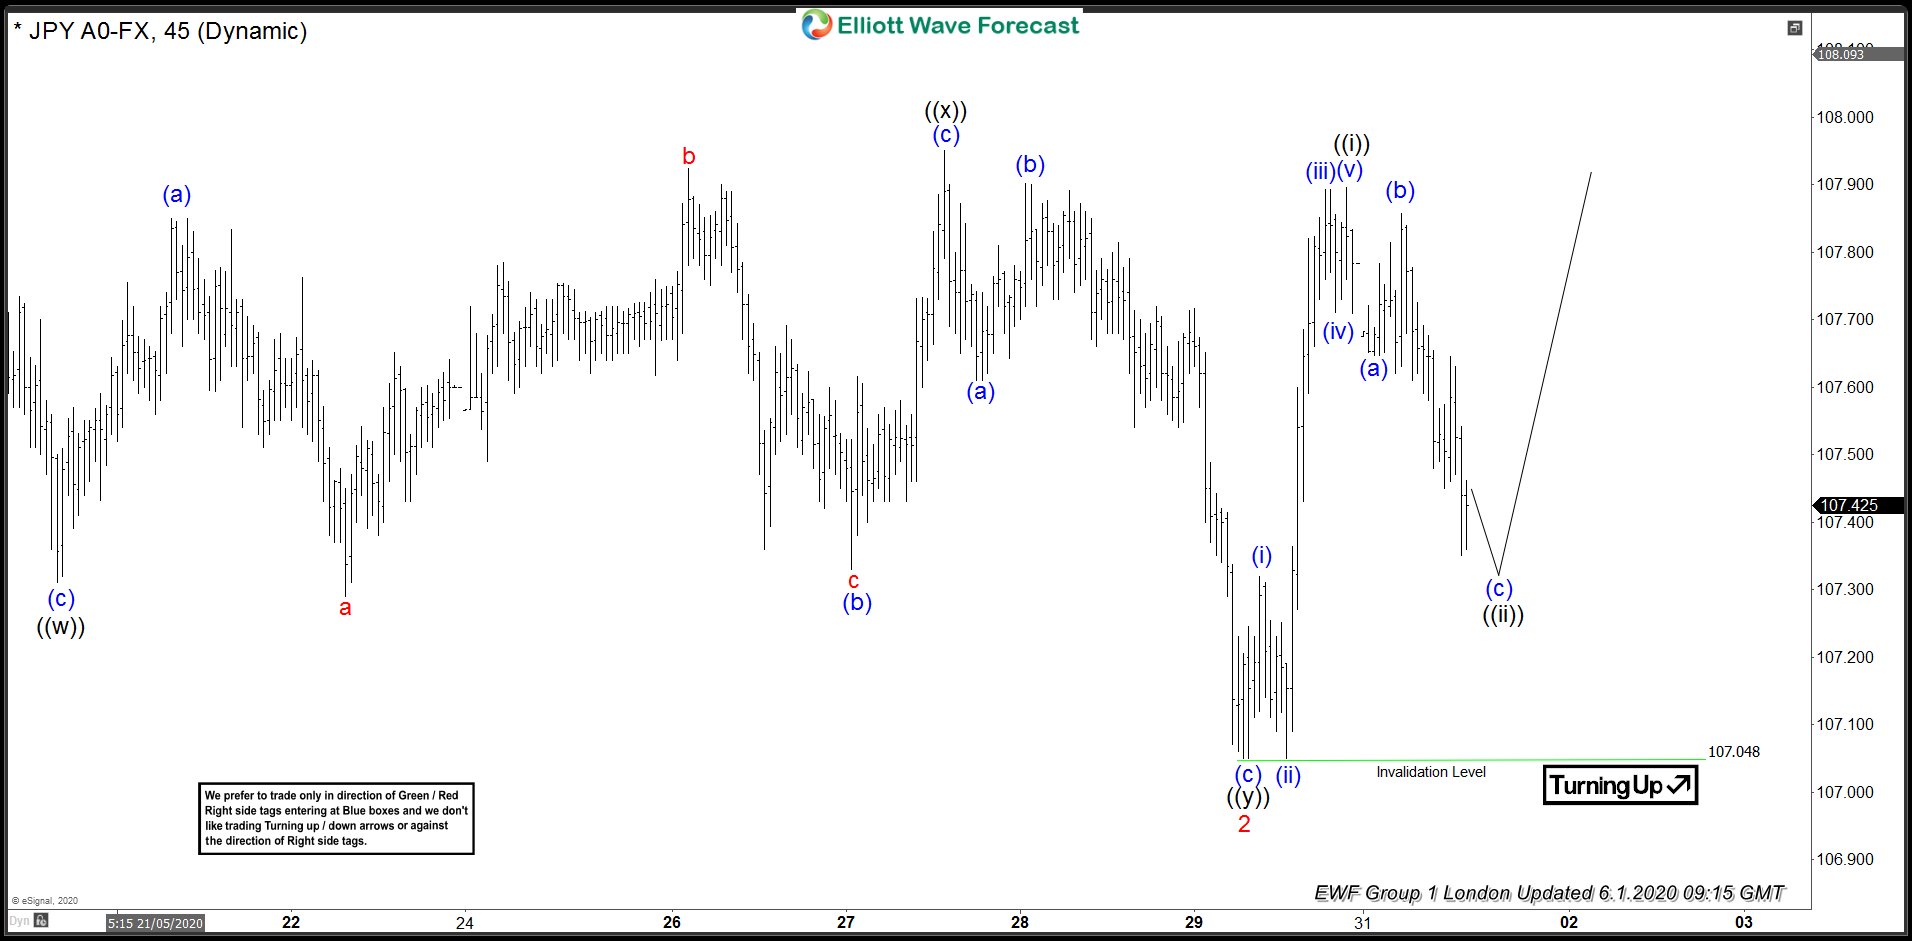
USDJPY 1 June 1 Hour London Elliott Wave Analysis
Chart below shows a double correction in wave 2 ended at 10.704 which was followed by a 5 waves rally which we labelled as wave ((i)), first wave of wave 3 higher. Pair experienced a pull back heading into the London update on Monday, we expected the pull back to complete above 107.04 and pair to resume higher in wave ((iii)) of 3.
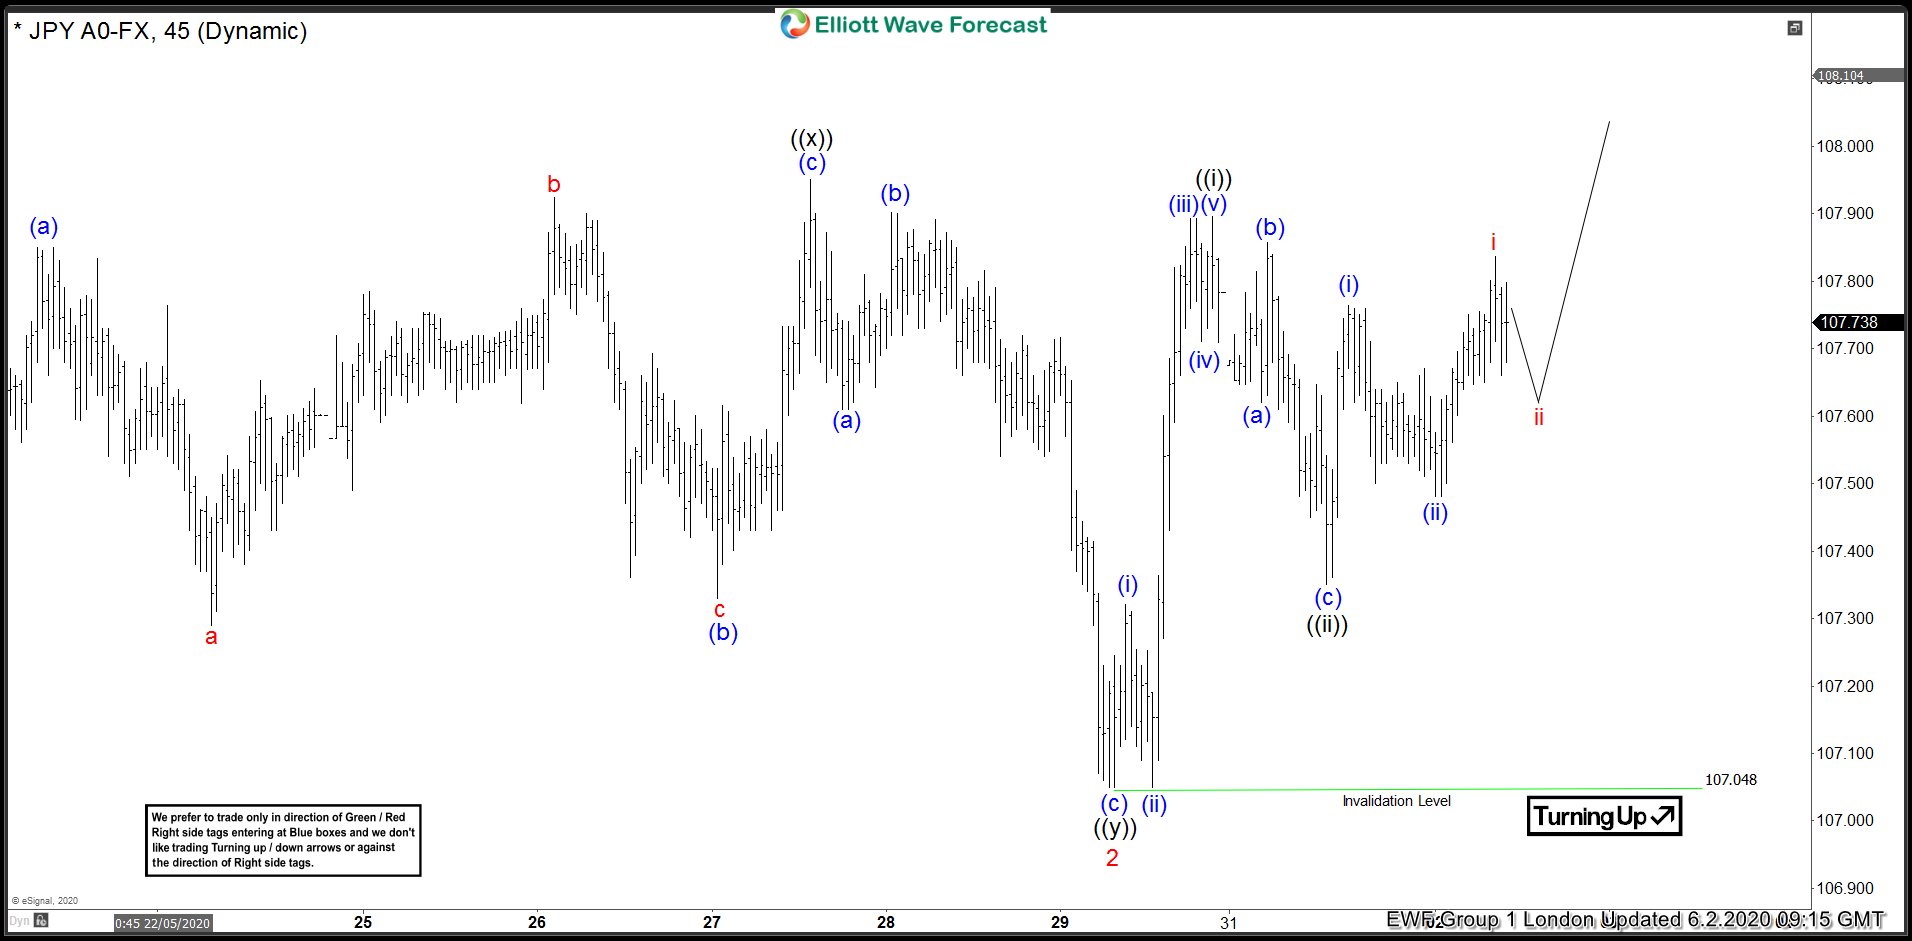
USDJPY 2 June 1 Hour London Elliott Wave Analysis
USDJPY 2 June 1 Hour Midday Elliott Wave Analysis
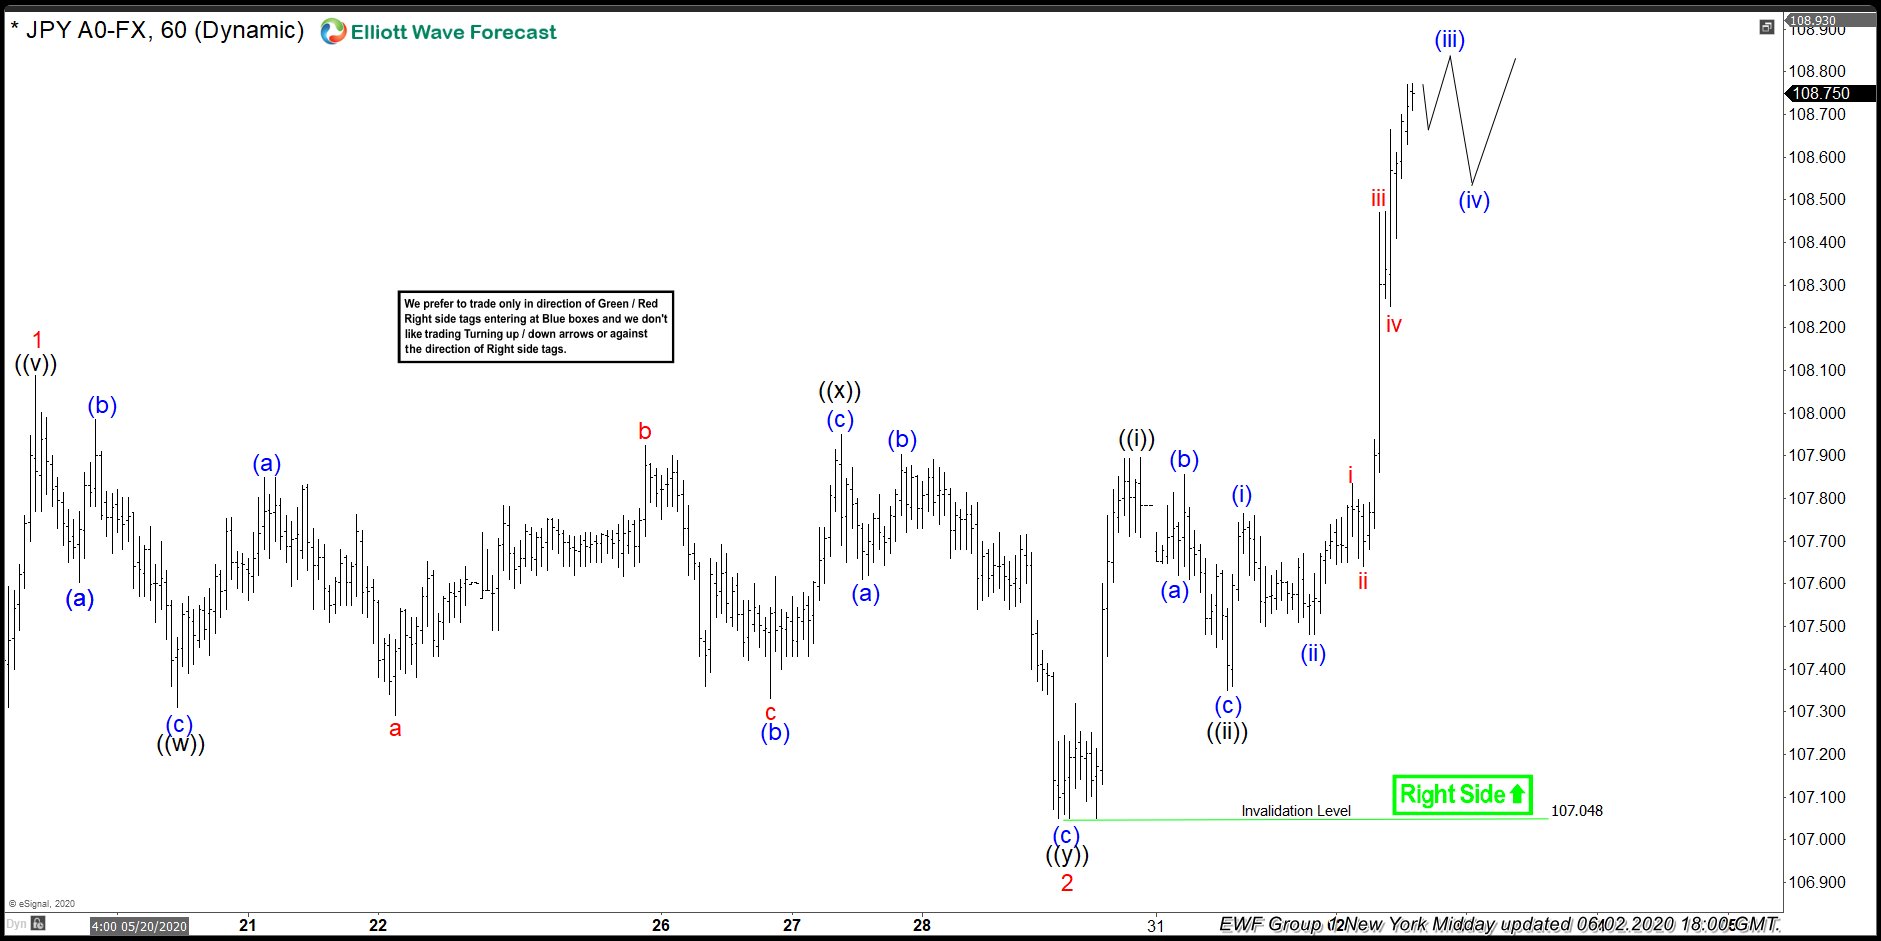
USDJPY 3 June 1 Hour London Elliott Wave Analysis




Comments
Log in or sign up to join the conversation.