

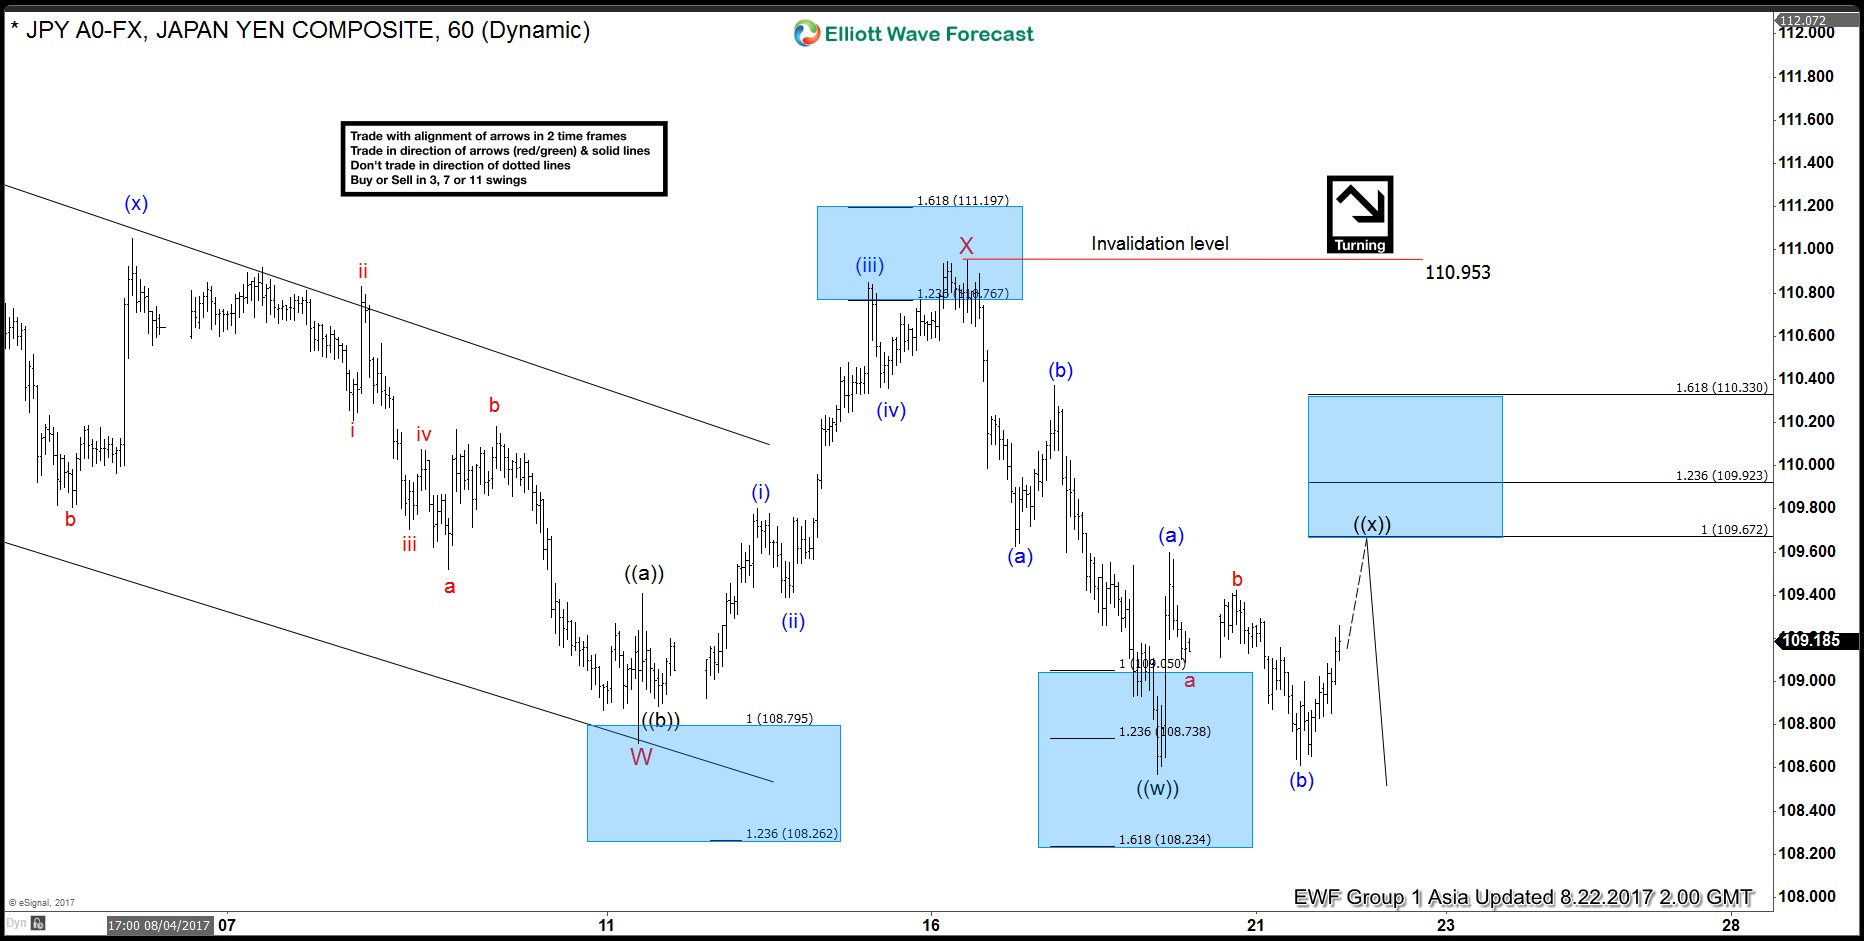
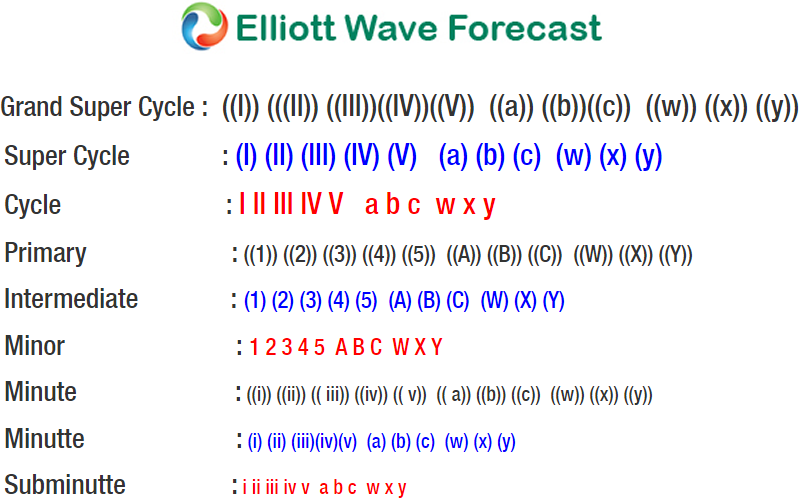
Short term USD/JPY Elliott wave view suggests that the decline from the 7/11 peak is unfolding as a double three Elliott wave structure. Decline to the 108.71 low ended Minor wave W and correction of that cycle ended in a Minor wave X at 110.95 peak. Subdivision of Minor wave Y is unfolding as a Zigzag structure. Minute wave ((w)) of ((Y) ended at the 108.59 low and Minute wave ((x)) of (Y) bounce is in progress as another Zigzag structure.
Up from the 108.59 wave ((w)) low, Minute wave (a) of ((x)) ended at the 109.6 peak and Minute wave (b) of ((x)) pullback ended at 108.609. Above from there, Minute wave (c) of ((x)) is in progress towards 109.67-109.92 or 100%-123.6% Fibonacci extension area of (a)-(b). Afterwards, the pair should resume the decline or pull back in 3 swings at least. We don’t advise buying the pair into the bounce. Expect sellers to appear after the Minute wave ((x)) bounce is complete in 3, 7 or 11 swings for further downside, provided pivot at 110.95 peak stays intact.
1 Hour USDJPY Elliott Wave Chart
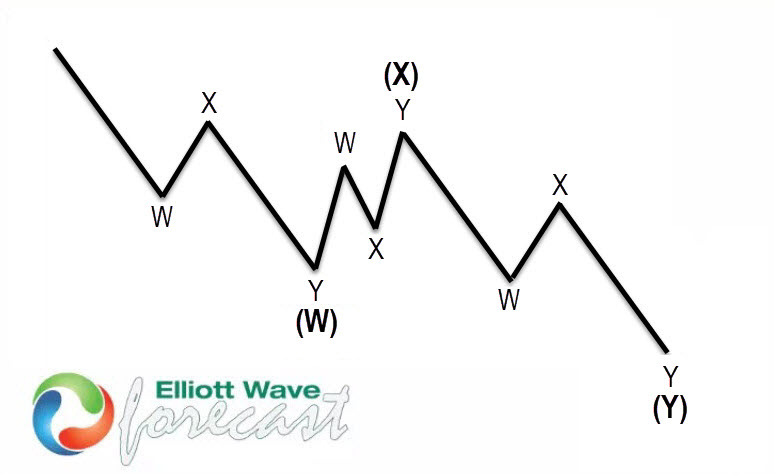
Double Three is the most important pattern in Elliott wave’s new theory and probably the most common pattern in the market these days. Double three is also known as a 7-swing structure. It is a very reliable pattern that gives traders a good opportunity to trade with a well-defined level of risk and target areas. The image below shows what Elliott Wave Double Three looks like. It has labels (W), (X), (Y) and an internal structure of 3-3-3. This means that all 3 legs has corrective sequences. Each (W) and (Y) is formed by 3 wave oscillations and has a structure of A, B, C or W, X, Y of smaller degrees.



Comments
Log in or sign up to join the conversation.