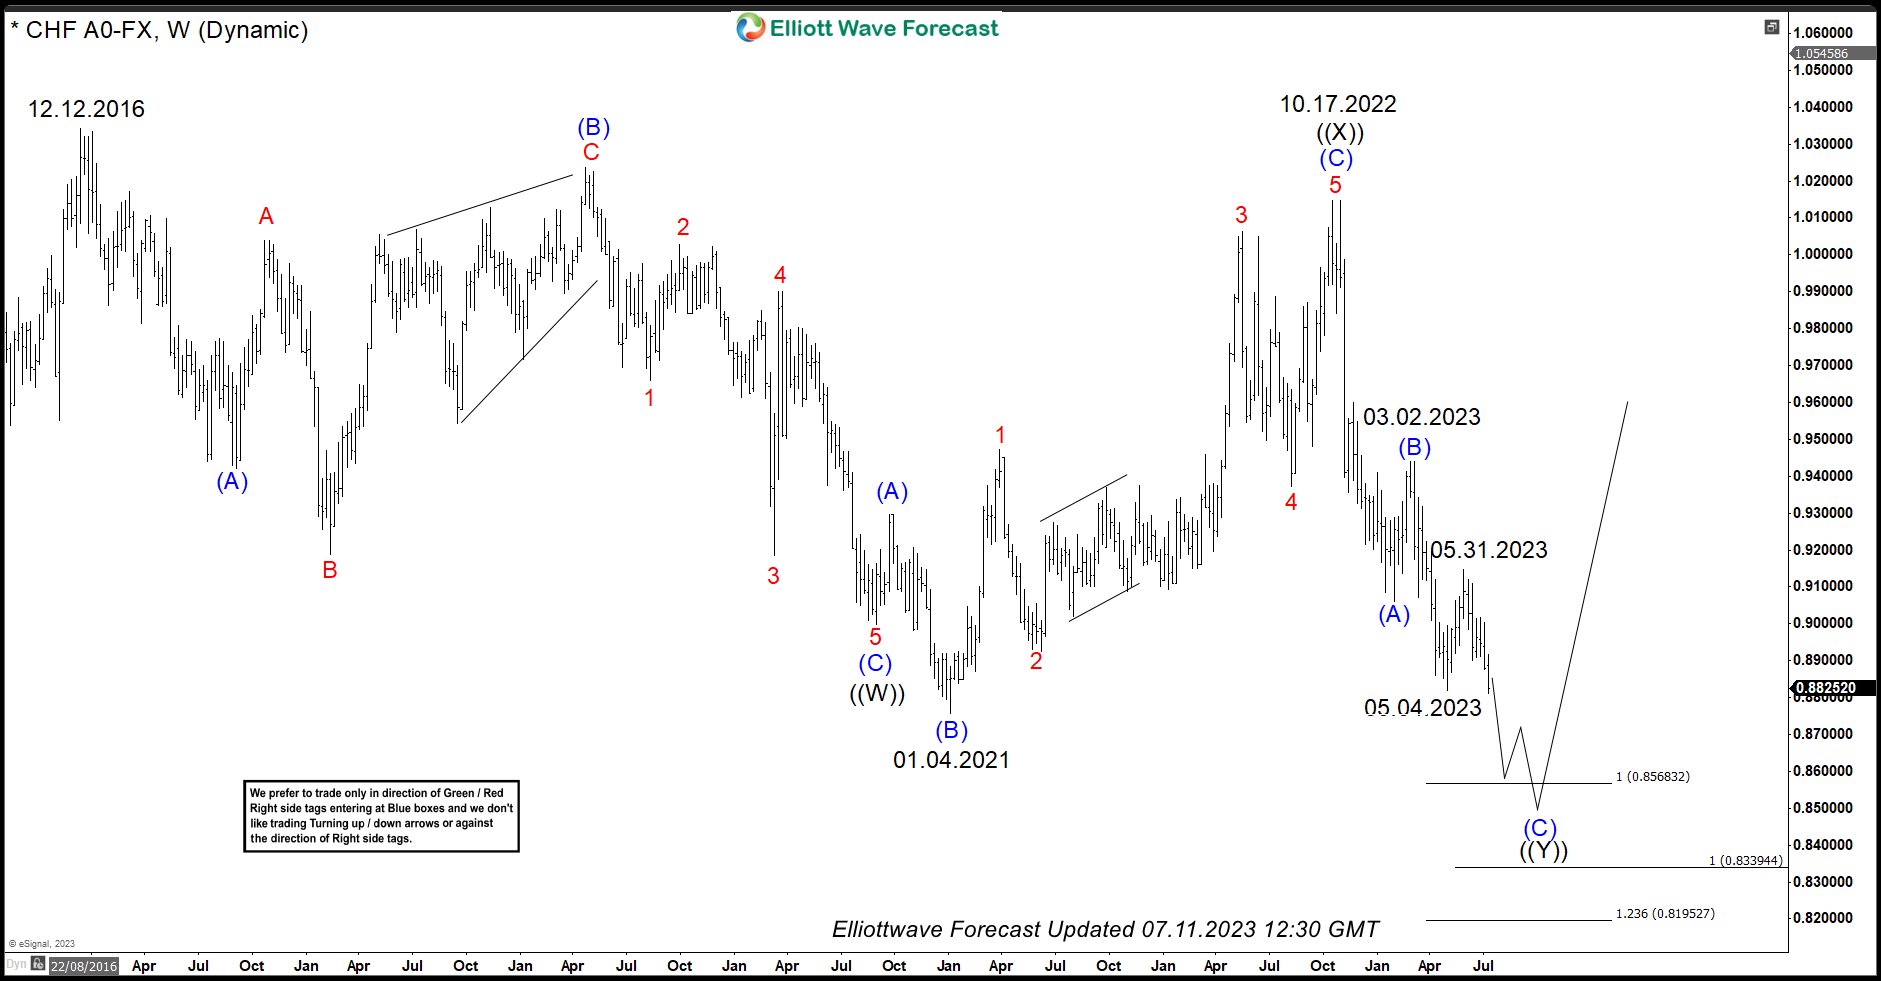
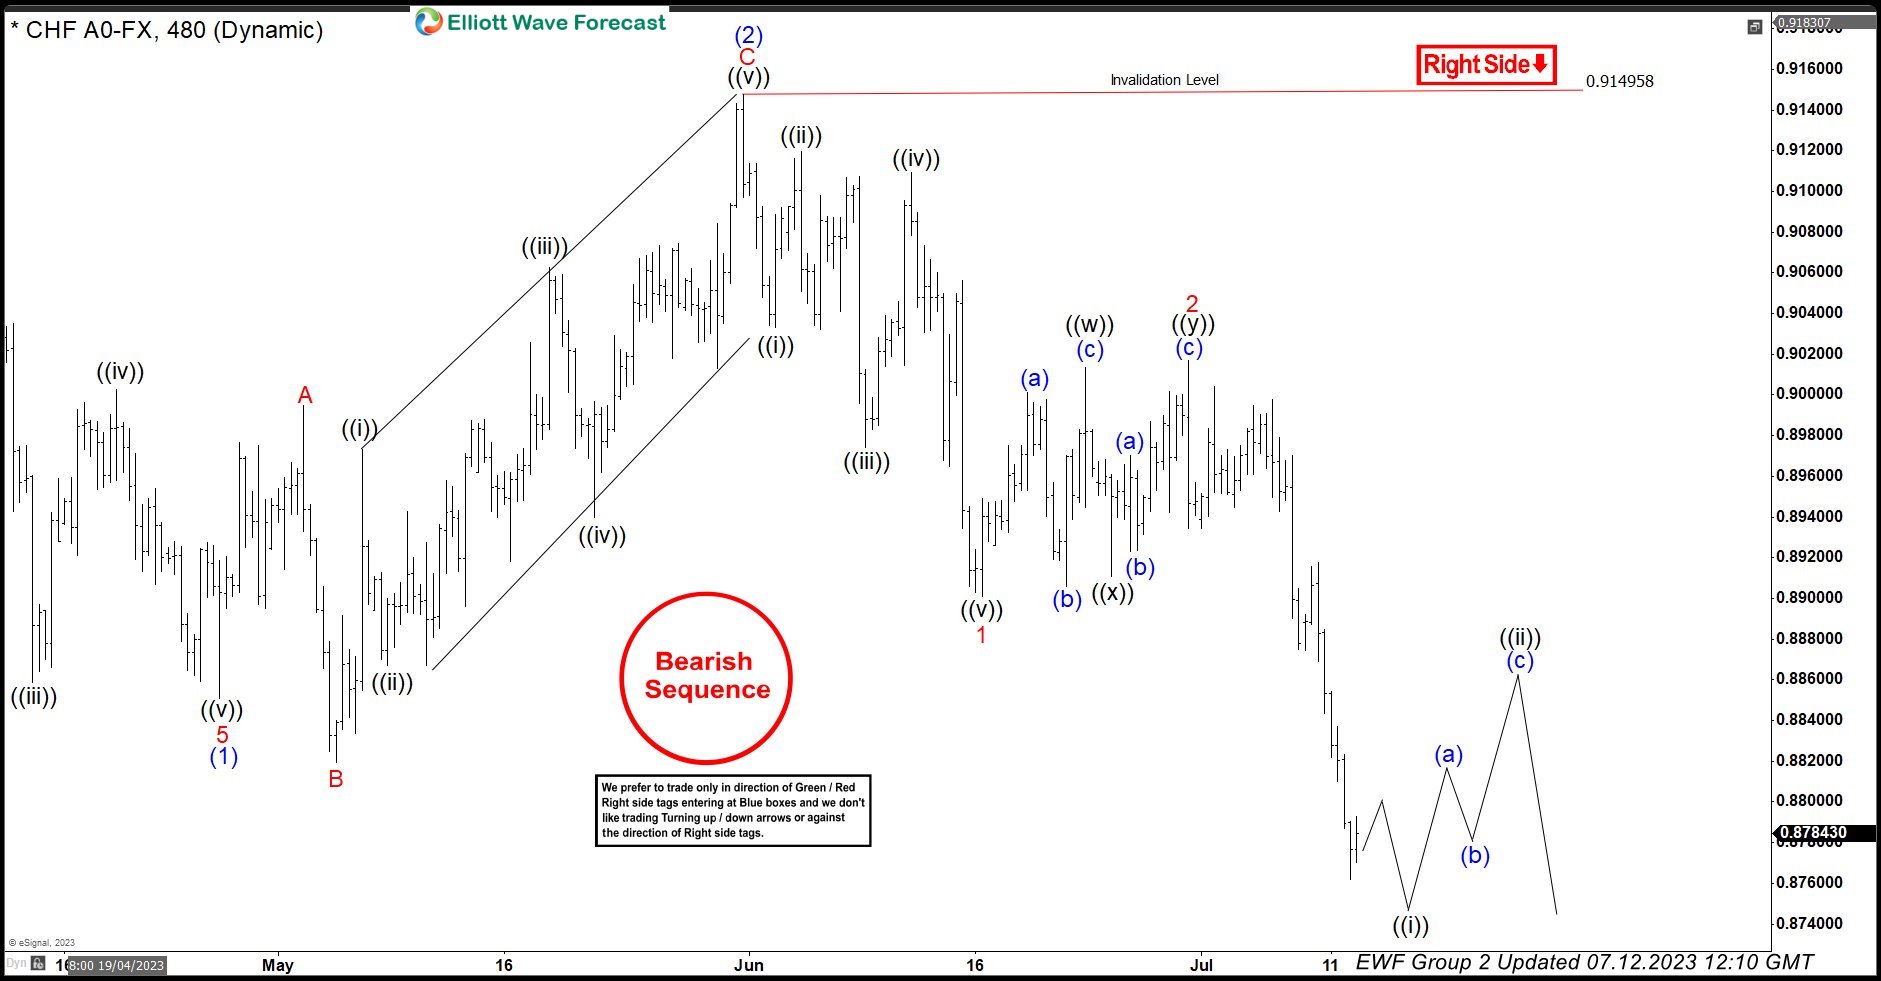
In today’s blog, we will take a look at the USDCHF Swing Sequence down from December 2016 peak and from October 2022 peak.
In today’s blog, we will take a look at the USDCHF Swing Sequence down from December 2016 peak and from October 2022 peak. Even when the pair has not yet broken below January 2021 low, it already has a double incomplete sequence down from October 2022 peak and also from March 2023 peak. We will look at these sequences and the extreme areas they relate to, how we like to trade the pair going forward and what it means for US Dollar Index and rest of USDX pairs.
USDCHF Weekly Chart Showing Sequence Down from December 2016 Peak
Futures, options, and over the counter foreign exchange products may involve substantial risk and may not be suitable for all investors. Leverage can work against you as well as for you. You should therefore carefully consider your investment experience as well as financial condition before deciding if trading is suitable for you.
Disclaimer:This and other personal blog posts are not reviewed, monitored or endorsed by
TalkMarkets. The content is solely the view of the author and TalkMarkets is not
responsible for the content of this post in any way. Our curated content which is
handpicked by our editorial team may be viewed here.





Comments
Log in or sign up to join the conversation.