

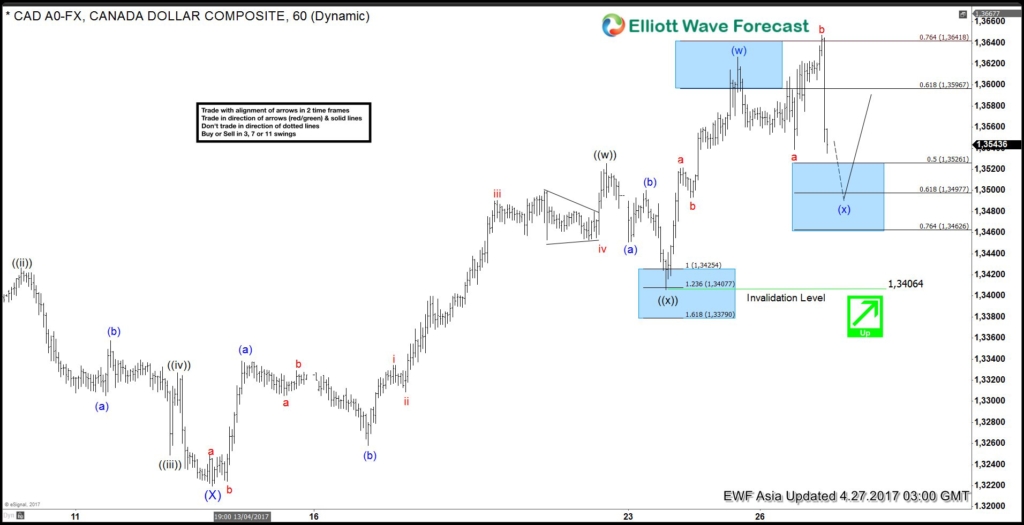
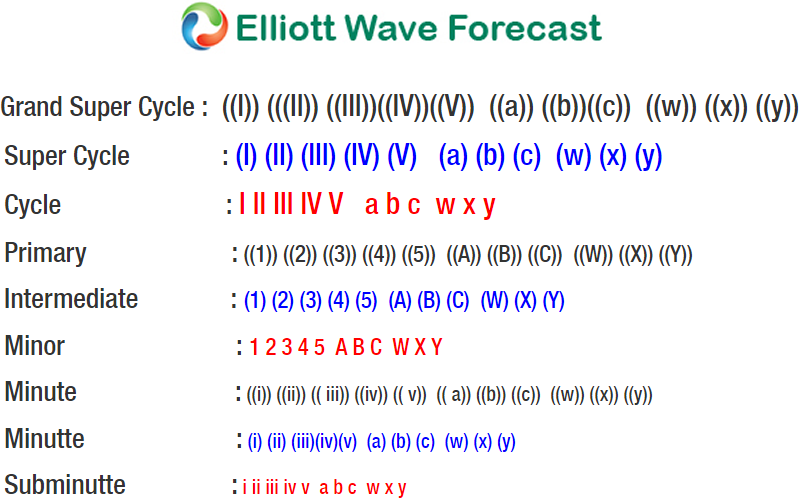
Short term Elliott Wave view in USDCAD suggests that the decline to 1.322 ended at Intermediate wave (X). The rally from there is unfolding as a double three Elliott Wave structure where Minute wave ((w)) ended at 1.3525 and Minute wave ((x)) ended at 1.3406. Minute wave ((w)) is subdivided as a Flat Elliott wave structure where Minutte wave (a) ended at 1.3338 and Minutte wave (b) ended at 1.3258. Near term, pair is within Minutte wave (x) Flat pullback to correct the cycle from 4/24 low towards 1.346 – 1.3498 area before the rally resumes. We don’t like selling the proposed pullback and expect buyers to appear once wave (x) pullback is complete in 3, 7, or 11 swing as far as pivot at 1.3406 stays intact.
USDCAD 1 hour Elliott Wave Chart 04/27/2017
(Click on image to enlarge)



Comments
Log in or sign up to join the conversation.