
- DXY resumes the decline and drops to new lows.
- The 103.00 zone emerges as the next support.
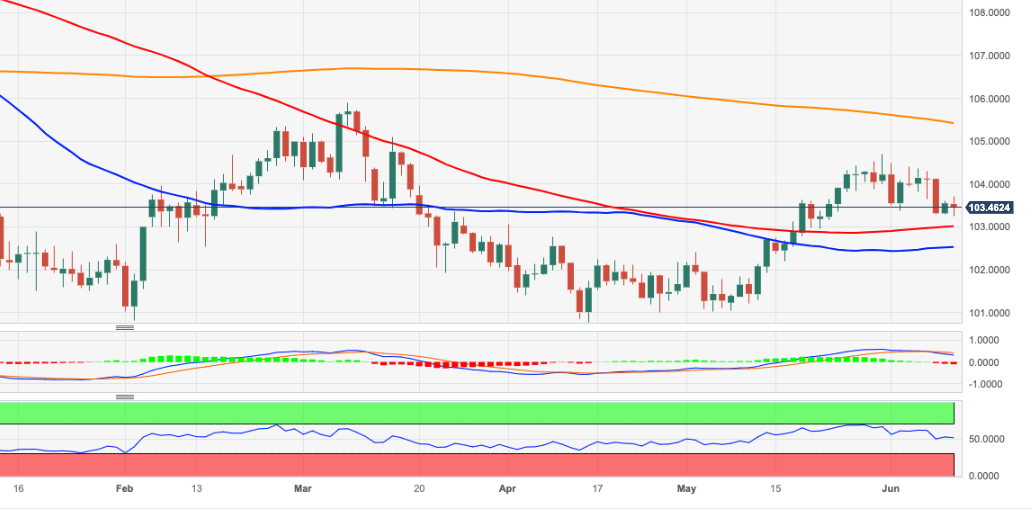
DXY leaves behind Friday’s decent advance and refocuses on the downside, clocking at the same time new multi-week lows in the 103.25/20 band on Monday.
In case the index extends the retracement, it could then put the transitory 100-day SMA around 103.00 to the test ahead of the provisional 55-day SMA at 102.52.
Looking at the broader picture, while below the 200-day SMA at 105.42 the outlook for the index is expected to remain negative.
DXY daily chart
(Click on image to enlarge)
Dollar Index Spot
| OVERVIEW | |
|---|---|
| Today last price | 103.45 |
| Today Daily Change | 46 |
| Today Daily Change % | -0.10 |
| Today daily open | 103.55 |
| TRENDS | |
|---|---|
| Daily SMA20 | 103.66 |
| Daily SMA50 | 102.52 |
| Daily SMA100 | 103 |
| Daily SMA200 | 105.29 |
| LEVELS | |
|---|---|
| Previous Daily High | 103.61 |
| Previous Daily Low | 103.29 |
| Previous Weekly High | 104.4 |
| Previous Weekly Low | 103.29 |
| Previous Monthly High | 104.7 |
| Previous Monthly Low | 101.03 |
| Daily Fibonacci 38.2% | 103.49 |
| Daily Fibonacci 61.8% | 103.41 |
| Daily Pivot Point S1 | 103.36 |
| Daily Pivot Point S2 | 103.17 |
| Daily Pivot Point S3 | 103.05 |
| Daily Pivot Point R1 | 103.67 |
| Daily Pivot Point R2 | 103.8 |
| Daily Pivot Point R3 | 103.99 |
More By This Author:
Natural Gas: A Near-Term Rebound Looks ProbableNatural Gas Futures: Extra Gains Appear Limited
USD Index Price Analysis: Lack Of Direction Points To Some Side-Lined Trade


Comments
Log in or sign up to join the conversation.