
- DXY fades Tuesday’s uptick and returns to the sub-104.00 region
- Further choppiness seems probable in the near term .
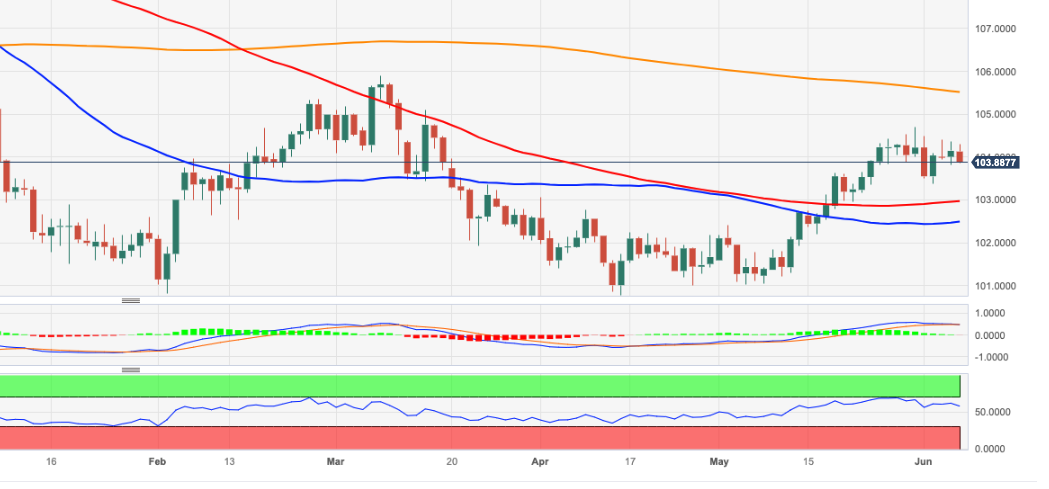
DXY leaves behind Tuesday’s decent gains and resumes the downside below the key 104.00 support on Wednesday.
Considering the ongoing price action, the index could now move into a consolidative phase in light of the current lack of strong catalysts. On the downside, the June low of 103.38 (June 2) emerges as the immediate contention, while the next up-barrier is seen at the May peak of 104.79 (May 31).
Looking at the broader picture, while below the 200-day SMA at 105.51 the outlook for the index is expected to remain negative.
DXY daily chart
(Click on image to enlarge)
Dollar Index Spot
| OVERVIEW | |
|---|---|
| Today last price | 103.92 |
| Today Daily Change | 44 |
| Today Daily Change % | -0.21 |
| Today daily open | 104.14 |
| TRENDS | |
|---|---|
| Daily SMA20 | 103.42 |
| Daily SMA50 | 102.45 |
| Daily SMA100 | 102.96 |
| Daily SMA200 | 105.39 |
| LEVELS | |
|---|---|
| Previous Daily High | 104.37 |
| Previous Daily Low | 103.81 |
| Previous Weekly High | 104.7 |
| Previous Weekly Low | 103.38 |
| Previous Monthly High | 104.7 |
| Previous Monthly Low | 101.03 |
| Daily Fibonacci 38.2% | 104.16 |
| Daily Fibonacci 61.8% | 104.03 |
| Daily Pivot Point S1 | 103.85 |
| Daily Pivot Point S2 | 103.55 |
| Daily Pivot Point S3 | 103.28 |
| Daily Pivot Point R1 | 104.41 |
| Daily Pivot Point R2 | 104.67 |
| Daily Pivot Point R3 | 104.97 |
More By This Author:
Crude Oil Futures: Further Retracement Not Ruled OutUSD Index Price Analysis: A Test Of The May Top Near 104.80 Is Still Likely
Natural Gas Futures: Scope For Further Gains Near Term


Comments
Log in or sign up to join the conversation.