

“Stocks on Friday plunged to a three-year low, closing out their worst week since the 2008 financial crisis and obliterating all of the gains made since President Donald Trump was inaugurated, as investors weighed the escalating coronavirus outbreak against vast stimulus measures designed to mitigate the crisis.
The losses, which came to more than 4% for the S&P 500 and Dow during Friday’s session alone, brought the S&P 500’s total weekly losses to 15% for its worst weekly performance since October 2008. The Dow swan-dived 17.3% on the week, with all the benchmarks settling at their lowest levels since early 2017.” Yahoo Finance
The US stock market had very steep losses for the week ending on Friday, March 20. All major stock market indexes hit a three-year low. The Federal Reserve cut rates by 100 basis points, with the benchmark Fed fund rate to a range of 0% to 0.25%. The US government said it will apply a huge stimulus plan, estimated at more than $1.0 trillion to boost the economy and support the workforce. It is too risky to make any prediction now if the stock market is bottoming. The reason for that is that panic, fear and extreme volatility are all present and dominant in the global financial markets. And from a fundamental analysis, all estimates about what the real negative impact on both the economy and stocks will be are just estimates. We will have to wait at least three consecutive quarters to evaluate the impact of the coronavirus crisis on the global economy and the US economy.
U.S. Retail Sales
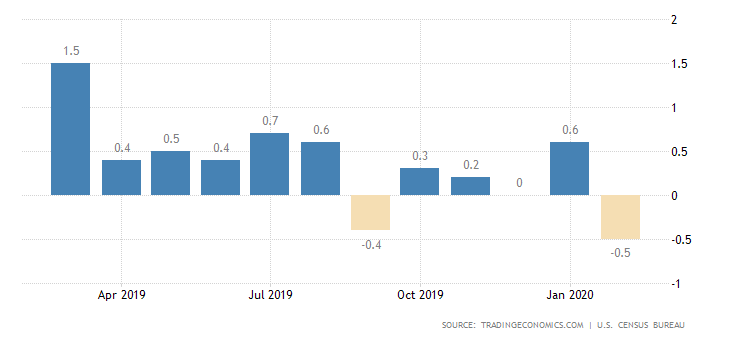
“Retail sales in the US dropped 0.5 percent from a month earlier in February 2020, following an upwardly revised 0.6 percent increase in January and missing market expectations of a 0.2 percent rise. It was the largest decline in trade since December 2018 as consumers cut back spending on a range of products, including motor vehicles & parts (-0.9 percent vs 0.8 percent), furniture (-0.4 percent vs 3.2 percent), electronics & appliances (-1.4 percent vs 0.6 percent), building materials (-1.3 percent vs 3.3 percent), health & personal care products (-0.1 percent vs 0.8 percent) and clothing (-1.2 percent vs -1.4 percent). Receipts also declined at gasoline stations (-2.8 percent vs -0.4 percent), restaurants & bars (-0.5 percent vs 0.8 percent) and general merchandise stores (-0.1 percent vs 0.5 percent). Excluding automobiles, gasoline, building materials and food services retail sales were unchanged last month after increasing by 0.4 percent in January.” -Trading Economics
On March 17, 2020, the figure for the monthly US retail sales showed weakness as expected, and this trend for retail sales is a key metric to measure the economic slowdown or even possible recession for the US economy. The next few months will be indicative of the economic performance and the impact of retail sales on the GDP.
For the week of March 16– March 20, 2020, the major US stock market indexes closed as follows on Friday, March 20, 2020:
• Dow Jones Industrial Average: Close 19173.98, -17.30% for the week, -32.81% Year-to-date
• S&P 500 Index: Close 2304.92, -14.98% for the week, -30.94% Year-to-date
• NASDAQ: Close 6879.52, -12.64% for the week, - 23.33%, Year-to-date
• Russell 2000: Close 1013.89, -16.22% for the week, -32.67% Year-to-date
Weekly Stock Gainers
These are the top gainers, stocks with five days of consecutive price advances:
1. Zoom Video Communications Cl A (Nasdaq: ZM), Close 130.55, 5-day change +21.48%
2. Glory Star New Media Group Holdings Ltd. (Nasdaq: GSMG), Close 3.50, 5-day change +19.66%
Weekly Stocks Losers
These are the top 3 losers, stocks with 5 days of consecutive price declines:
1. Redwood Trust (NYSE: RWT), Close 4.85, 5-day change -61.39%
2. Colony Northstar Credit Real Estate Inc Class (NYSE: CLNC), Close 2.81, 5-day change -60.31%
3. Viad Corp (NYSE: VVI), Close 11.90, 5-day change -60.07%
The economic calendar for the week March 16- March 20, 2020:
The economic data to focus on this week are the preliminary manufacturing and services Purchasing Managers Indexes, the durable goods, the University of Michigan sentiment and the Gross Domestic Product annualized (QoQ) (4Q).
Sources:
https://quotes.wsj.com/index/US/COMP
https://www.barchart.com
https://www.dailyfx.com/economic-calendar


Comments
Log in or sign up to join the conversation.