
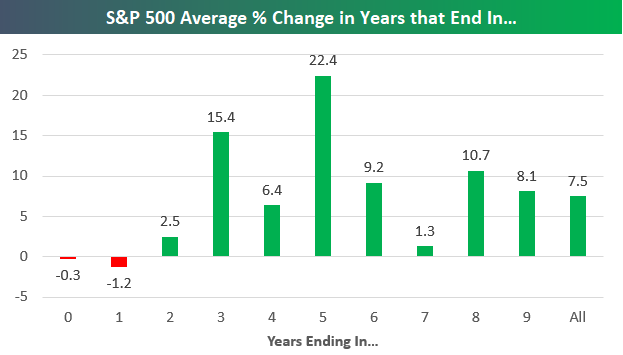
Below is a quick market stat to log as 2018 nears an end and 2019 approaches. In the chart, we show the S&P 500’s average price change in years ending in 0 through 9. This data goes back to 1928 when the S&P 500 begins.
As shown, years ending in “8” have historically seen the S&P 500 gain an average of 10.7%. At one point earlier in 2018, this type of gain seemed likely, but not anymore now that the S&P is down 2% YTD.
Years ending in “9” have historically seen an average gain of 8.1%, which is just a hair above the average of 7.5% seen for all years since 1928.
The best years have come in years ending in “5” with an average gain of 22.4%. Years ending in “3” rank second with a gain of 15.4%.
On the negative side, years ending in “0” and “1” have both averaged losses throughout history.
(Click on image to enlarge)
Below we show the consistency of positive returns for the S&P 500 in years ending in “0” through “9”.As shown, years ending in “5” have been positive 88.9% of the time (8 out of 9), while years ending in “0” and “1” have been positive just 44.4% of the time (4 out of 9).
(Click on image to enlarge)


Comments
Log in or sign up to join the conversation.