

The ranks of lower and middle class households in the United States is thinning. The reason why is remarkable: more households are earning higher incomes, allowing them to move up into the top ranks of the nation's income spectrum.
You don't have to take our word for it. We've organized the U.S. Census Bureau's inflation adjusted data for household income from 1967 through 2024 into three groups. The first group contains households with annual total money income of $49,999 or less, which represents lower income-earning households. The second group contains households earning between $50,000 and $149,999 to represent middle income-earning households. The third group contains all households earning $150,000 or more.
The following chart confirms the percentage share of lower and middle-class households in the U.S. is shrinking as the percentage of upper-class households increases.
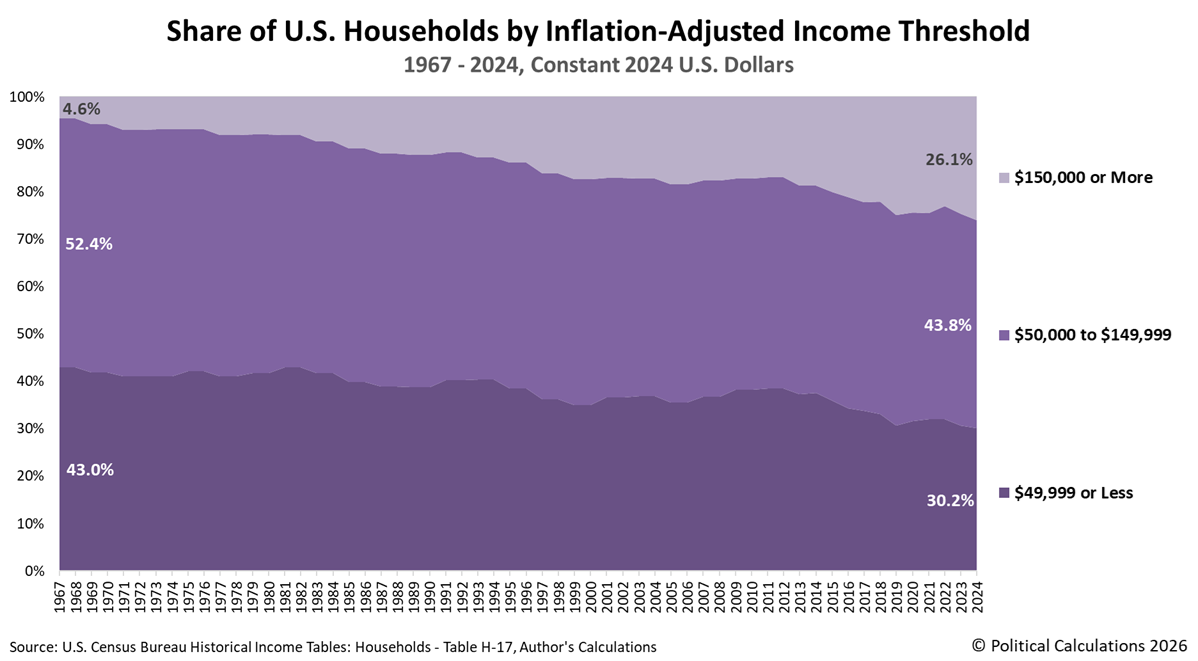
U.S. households earning $150,000 or more in inflation-adjusted constant 2024 U.S. dollars have risen from 4.6% of all households to 26.1% from 1967 through 2024. Middle-ranked households earning between $50,000 and $149,999 has fallen from 52.4% to 43.8% of all U.S. households. The lowest-ranked households earning real incomes of $49,999 or less has plunged from accounting for 43.0% of all U.S. households to just 30.2%.
A similar pattern holds for U.S. families. See more commentary on this phenomenon here and here.
Reference
U.S. Census Bureau. Historical Income Tables: Households. Table H-17. Households by Total Money Income, Race, and Hispanic Origin of Householder. [Excel spreadsheet]. 25 August 2025.
Comments
Log in or sign up to join the conversation.