

Douglas A. Irwin offers a brisk overview of a great American tradition–specifically, “America’s been arguing over trade for more than 250 years” (Peterson Institute for International Economics, July 1, 2026). I won’t rehearse the arguments here, but instead offer a couple of his big-picture graphs.
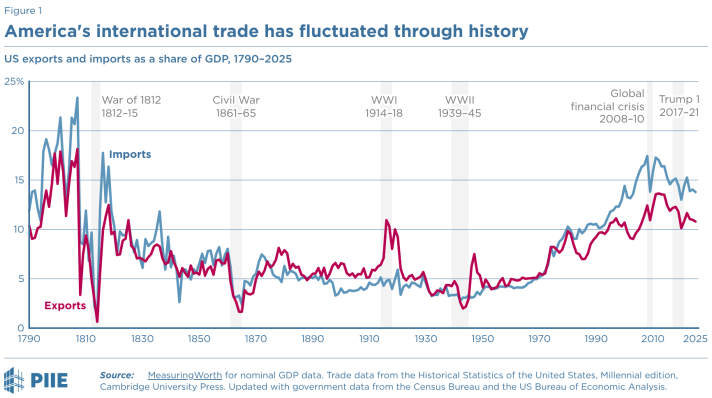
The first shows imports (blue line) and exports (red line) as a share of GDP from 1790 to 2025. Two patterns jump out at me. One is that from about 1840 to 1970, US imports and exports tended to hover around 5% of GDP. From about 1970 up to around 2010, trade as a share of GDP rose dramatically, but in the last decade or so it has levelled off. The other pattern worth noting is that during most of US history up through the early 1990s, imports and exports were in rough balance, with occasional exceptions. But for the last 30 years or so, US imports have consistently exceeded exports. To put it another way, total US consumption (including imports) has been exceeding total US production (including exports). While the standard political tendency is to blame other countries for not buying enough US exports, addressing the trade deficit in a real way will require facing up to the question of why the US economy consumes more than it produces–which in turn will require coming to grips with the enormous US budget deficits.
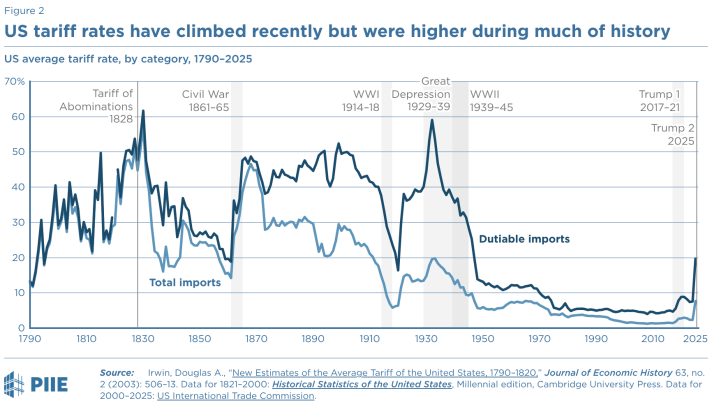
The second figure shows US tariff rates from 1790 to 2025. The average tariff rate can be calculated in various ways: in this figure, the black line shows average tariffs only for imports where tariffs apply, while the blue line shows average tariffs relative to total imports, including the imports where tariffs don’t apply. The big-picture pattern here is that tariffs were much higher for much of US history, then dropped off dramatically after the Great Depression and World War II, before the recent Trump bump to tariffs. It’s also interesting to consider the size of the gap between the two lines; if tariffs are applied to most imports, then the black and blue lines appear quite similar, as they did from 1790 up through about 1870. But then tariffs start being applied much more selectively to specific industries and goods, so the tariffs applied to those imports are higher than tariffs considered from the perspective of total imports.
A final point not illustrated here is that US federal spending was typically around 2% of GDP for the first 130 years or so of US history. But after the sequence of World War I, the Great Depression, and World War II, federal spending rose substantially, and has averaged about 21% of GDP in the last 50 years. The sources of federal funds are primarily individual and corporate income taxes, along with payroll taxes, with tariffs much less needed as a revenue source since around 1950.


Comments
Log in or sign up to join the conversation.