


The US unemployment rate was 4.2% in June, which is low by historical levels. Nonetheless, a lot of workers, and perhaps especially young workers right out of college, are experiencing the US economy as a situation where it’s hard to get a job. For example, in “The Job Market for Recent College Graduates,” I reviewed evidence that relative to other education groups, the unemployment rate for recent graduates is higher than usual, while in certain jobs, the job growth for those age 22-27 seems lower than usual. In “Are the Entry-Level Jobs Drying Up for Young Adults?” I discussed flows between unemployment, being out of the labor force, and taking a job. There are some bits of new evidence on each question.
Bruce Fallick of the Cleveland Fed discusses “The `Low-hire, Low-fire’ Labor Market” (Economic Commentary 26-17, August 4, 2026). The green line on the graph shows the percent of new hires each month as a share of total employment; the maroon line shows the quit rate each month as a share of total employment; the blue line shows the layoff rate. (The pandemic years are left out, because the labor market goes whacky during that time.) Notice that layoffs have trended down a bit over time, but not moved much. However, in the last few years the hire and quit rates have both been dropping.
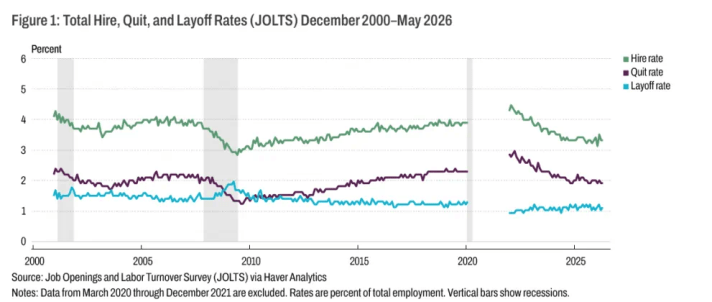
A high quit rate (that is, leaving a job voluntarily) is sometimes used as a measure of whether the job market is strong, because a strong job market means that people have more options for voluntarily leaving one job and moving to another. Conversely, you can see the quit rate and the hire rate both falling during the Great Recession from 2008-2010; the labor market was weak, so voluntary departures were less common. But it’s unusual to have the hire rate and quit rate falling at a time of relatively low unemployment.
Fallick looks back at other data sources and finds that this pattern of decline in the “fluidity” of the US labor market goes back at least to the 1980s. But this pattern seems to be evolving over decades, and its underlying causes are not clear. One possible reason is that the general aging of America means that the share of workers in mid-career and older is high. If such workers are less likely to leave voluntarily, then quit rates would be lower, and the need to hire would decline as well.
Another piece of labor market evidence comes from Ingrid Chen, Marianna Kudlyak, and Riva Mikhlin at the San Francisco Fed, who discuss “Job-Finding Anomalies of the Current Expansion” (FRBSF Economic Letter 26-20, August 5, 2026). Their starting point is that working-age adults can be divided into three groups: the employed who have jobs, the unemployed who don’t have a job but are actively looking, and the out-of-the-labor force who don’t have a job but are not actively looking. One can look at movements between these categories. The authors explain this way:
The job-finding rate for unemployed people is typically 25–30%, much higher than the typical job-finding rate for the nonparticipation group of 4–5%, showing that the unemployed are far more likely to find a job (Figure 1). This is not surprising because a large share of nonparticipants are retirees or students who are not looking or not interested in a job. However, even though their job-finding rate is relatively low, nonparticipants make up two thirds of all people who transition from nonemployment to employment each month on average. This is mainly because the pool of nonparticipants is much larger than the pool of unemployed individuals.
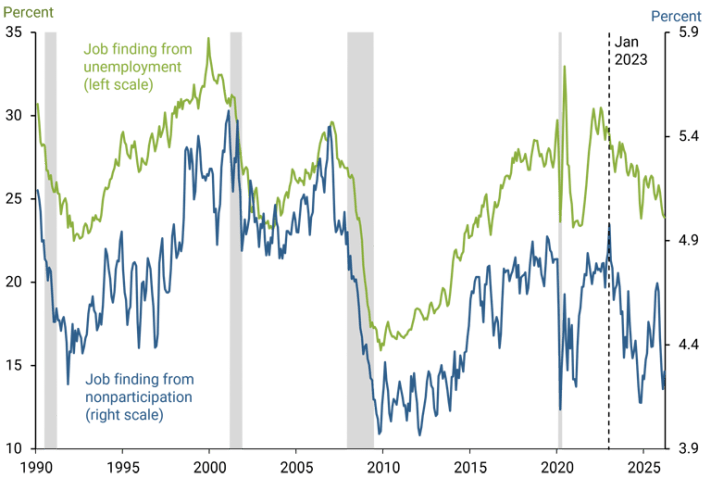
The graph is a little tricky to read, because the green line is being measured on the left-hand axis and the blue line on the right-hand axis. But looking at the green line and the right-hand axis, you can see that the movement from unemployment to a job has dropped from about 30% in 2023 to about 25% at present. So yes, it has become harder for someone who is actively looking for a job to find one.
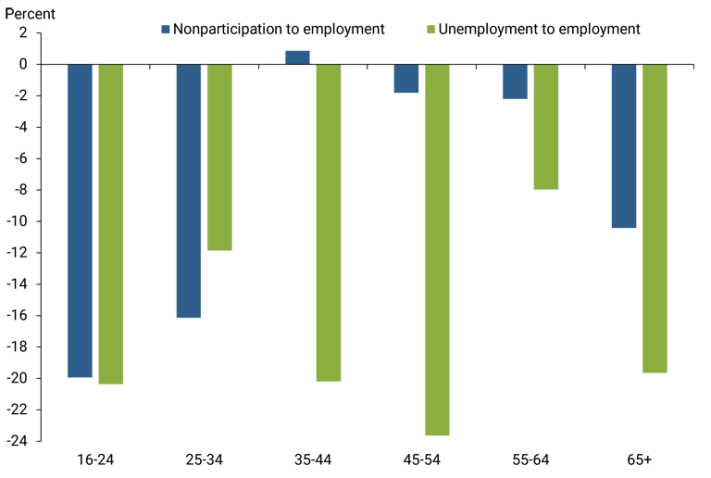
Now break down these patterns by age group, and look at the time period from January 2023 to January 2026. As the green bars show, movement from unemployment to a job drops off for all groups. However, movement from out-of-the-labor-force into a job drops off especially strongly for younger adults. To put it differently, for young adults entering the labor market, it has indeed become more difficult to find a job than it is for those in other age groups.
None of these patterns suggest that it’s a new Great Depression out there. But the patterns do suggest that the labor market is less fluid, which makes it hard for those trying to gain a foothold.


Comments
Log in or sign up to join the conversation.