


Debt topped $40 trillion today. But let’s discuss what really matters.
Staggering Headline
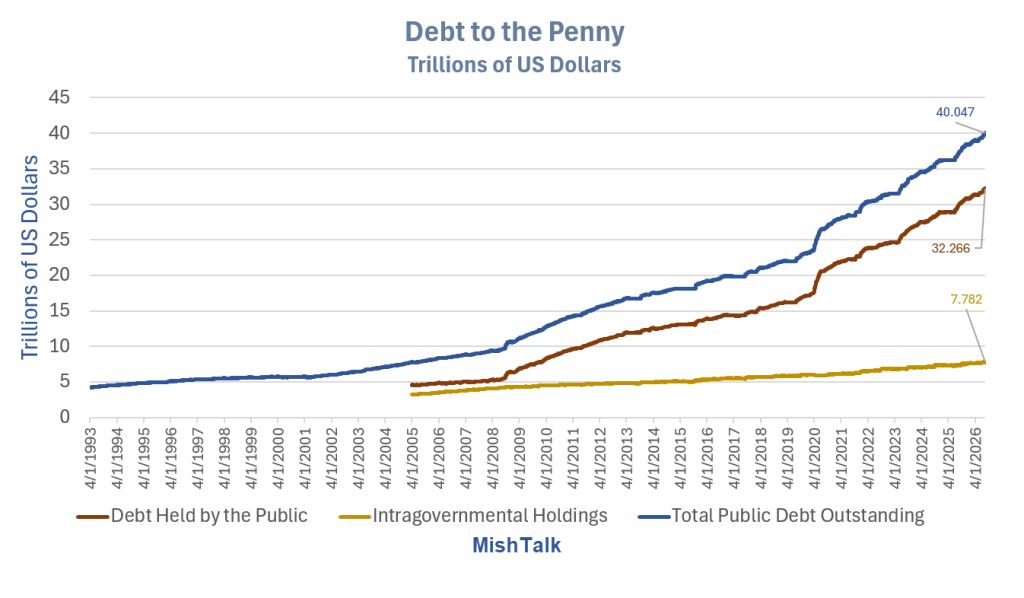
While crossing the $40 trillion milestone makes for a staggering headline, it is economically misleading. The number that actually drives financial markets, dictates national interest costs, and impacts inflation is Debt Held by the Public. To understand the true weight of the U.S. fiscal trajectory, one must strip away Intragovernmental Holdings. The total debt is an accounting aggregation; public debt is the actual economic reality.
Intragovernmental Holdings—which currently sit at roughly $7.78 trillion—represent money that the federal government collected by trust funds like Social Security and Medicare, which are legally required to be invested in special-issue Treasury securities. While these obligations represent real future political commitments to citizens, they do not require the government to go out into open capital markets to borrow cash today. They do not compete with private investment, nor do they directly dictate current market interest rates.
The real macroeconomic danger zone is the Debt Held by the Public, which has relentlessly surged to $32.26 trillion. This is the net amount of Treasury bonds, notes, and bills held by outside investors, including global central banks, domestic banks, mutual funds, and private citizens. Every single dollar of this $32.26 trillion must be actively financed on the open market. Unlike intragovernmental debt, public debt actively competes with private enterprise for capital, exerts upward pressure on yields, and requires massive cash payouts to external creditors.
Focusing strictly on the public debt also exposes the most alarming trend on the chart: the explosive rise in net interest servicing costs. Because the public debt must be constantly rolled over into open market auctions, the Federal Reserve’s prolonged fight against inflation means old, low-interest bonds are being replaced by debt yielding 4% to 5%. Consequently, net annual interest payments have skyrocketed to over $1.1 trillion, consuming roughly 19% of all federal revenues. This cash drains directly out of the budget to service public bondholders, starving the economy of resources without funding a single road, school, or military asset.
Federal Debt vs Debt to GDP 2026 Q1
The Macroeconomic Divergence
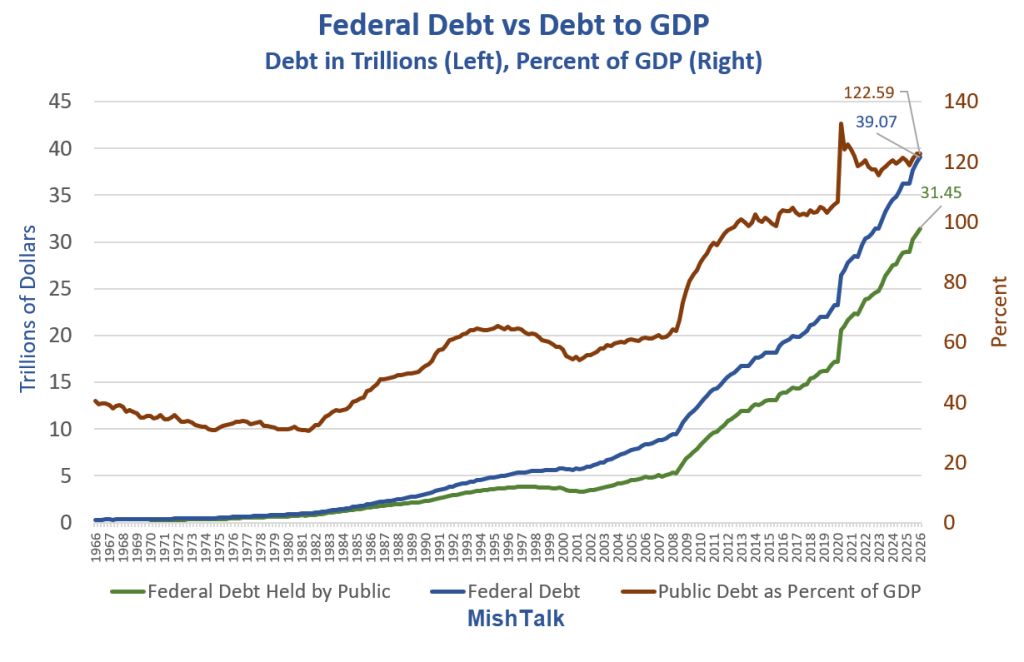
This dual-axis visual captures the core structural crisis of modern U.S. fiscal policy.
The trends expose the massive divergence between nominal debt accumulation and the economy’s structural ability to service it via actual economic growth (GDP).
The Post-2020 Real Estate / Pandemic Spike
The red line tracking Public Debt as a Percent of GDP dramatically underscores why tracking raw debt nominal totals misses the point. The massive parabolic vertical spike in 2020 topped out at a historic high-water mark of 122.59%.
A vast body of consensus research shows that crossing the 100% to 120% Debt-to-GDP threshold marks a critical structural tipping point where sovereign debt actively slows down economic growth.
The Global Baseline: The Reinhart-Rogoff Study
The intellectual foundation for this worry comes from the landmark National Bureau of Economic Research (NBER) study, Growth in a Time of Debt, by Harvard economists Carmen Reinhart and Kenneth Rogoff.
The Threshold: Analyzing 44 countries spanning over 200 years of data, they concluded that when an advanced nation’s public debt crosses 90% of GDP, economic performance drops off a cliff.
The Growth Penalty: For countries exceeding this baseline, median annual GDP growth rates dropped by roughly 1%, and average growth fell considerably more. While their exact 90% figure faced fierce coding and weighting critiques from economists at Amherst, the core principle of a structural ceiling remained deeply intact.
The Advanced Economy Shift
Subsequent metadata analyses expanded on the threshold concept. A comprehensive survey by the Cato Institute covering 40 separate academic papers tracking debt-to-growth dynamics confirmed that 36 out of 40 studies found a statistically significant, negative impact of excessive public debt on economic output.
The Modern Consensus: For advanced economies like the United States, the empirical mean threshold sits at 75% to 80% of GDP.
The Penalty Matrix: Academic models from the Mercatus Center calculate that for every 1-percentage-point increase in the debt-to-GDP ratio past this tipping point, annual economic growth is stifled by roughly 3.3 basis points.
The Structural Reality of 120%
When a nation cruises past 100% and touches 120%, the threat scales exponentially because of the “Crowding-Out Effect” and interest compounding.
Recent macroeconomic modeling by the International Monetary Fund (IMF) specifically quantified the long-term impact of permanently running a 120% debt-to-GDP ratio:
Capital Disruption: Sustaining a 120% debt load reduces a nation’s private capital stock by ~15% because government bond auctions absorb cash that would otherwise fund private corporate enterprise, R&D, and technological infrastructure.
Output Stagnation: This structural crowding-out permanently lowers steady-state GDP by ~8% over time.
The Congressional Budget Office (CBO) explicitly warns that pushing public debt to 120% over the next decade forces an unprecedented interest servicing spiral. Because old debt must be continuously rolled over at modern 4%–5% yields, interest servicing alone will rapidly devour 4.6% of entire U.S. GDP
The near-universal spotlight today on $40 trillion misses all of the above key points.
Rising Bond Yields
Bond yields have been soaring. This debt burden is part of the problem.
It’s exacerbated by the inflationary aspects of rising oil, the shutdown of the strait of Hormuz, and the inflationary aspects of terrible tariff policy.
This morning at 4:00 AM, I asked When Will the Price of Diesel and Gasoline Hit New Record Highs?
Diesel will be first, likely soon.
Diesel was $0.3482 from a new high at the time of my post. Today, the AAA reports the price of diesel has risen from $5.4677 to $5.5042.
The record high is $5.8159. Diesel is now $0.3117 from a record high.
Because oil is up again today, diesel is highly likely to be up again tomorrow.
Bond Market Manipulation
Today, in an attempt to calm the bond market, the Treasury Secretary started manipulating rates with bond purchases.
Since nothing is fixed by this manipulation, it cannot work.
For discussion, please see Long-Term Bond Yields Dive, Gold Soars as Treasury Manipulates Bond Yields
What market manipulation is next? Diesel crack spreads?
To understand why diesel is rising much faster than the price of gasoline, please see US Diesel Crack Surpasses $100 a Barrel for the First Time, Farmers Suffer
Record high crack spreads. Serious economic ramifications.
The short answer is there is a shortage of global refining capacity.
Bond manipulation sure will not fix that. Nor will bond manipulation fix out of control spending by Congress.
The Fed is not in a good spot.



Comments
Log in or sign up to join the conversation.