

We like to provide an update on trends in US home prices every few months based on the monthly release of the S&P/Case-Shiller home price indices. While the data has a 2-month lag, it’s still helpful for tracking longer-term trends in real estate prices from city to city across the US.
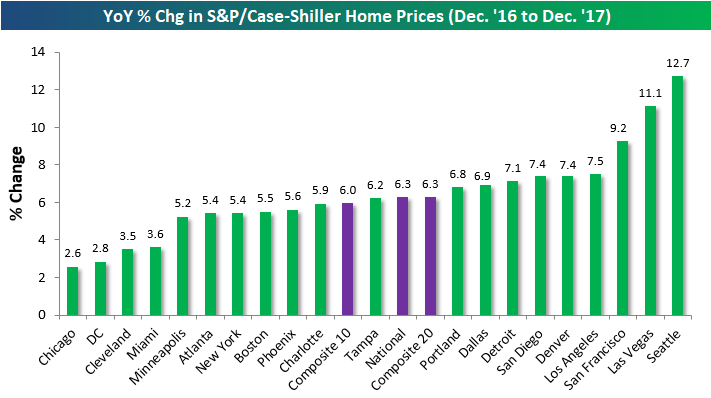
The first chart below shows the year-over-year change in home prices from December 2016 to December 2017 (remember, the data has a 2-month lag). As shown, the composite 10 and 20-city indices and the national index are all up roughly 6% y/y.
Seattle has seen the biggest y/y gains at +12.7% (can you take a guess why?), followed by Las Vegas and then San Francisco. On the lower end of the spectrum, Chicago, DC, Cleveland and Miami have seen the smallest year-over-year gains in home prices.
(Click on image to enlarge)
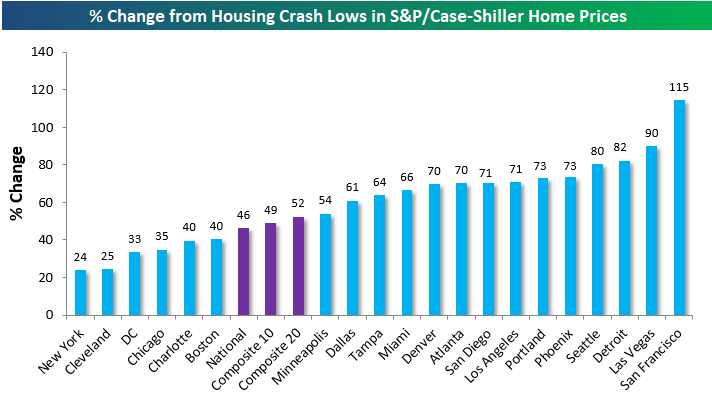
Another interesting way to look at the data is to see how much home prices are up from their post-housing bubble lows (most lows weren’t made until early 2012). The National index is now up 46% from its lows, but most cities are up well over 50% from their lows at this point. San Francisco is up by far the most at +115%, followed by Las Vegas (+90%), Detroit (+82%), and Seattle (+80%).
On the weaker side of things, New York and Cleveland have gained the least off their lows at roughly +25%. With the recent tax law changes, it’s going to be hard for New York to bring itself up from the rear.
(Click on image to enlarge)
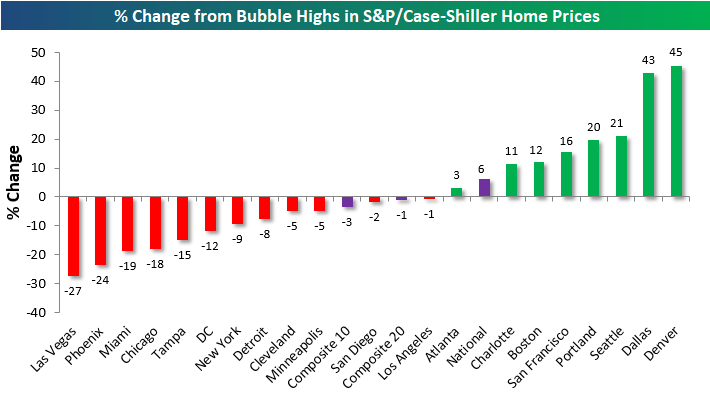
Finally, let’s take a look at how prices now compare to their prior housing bubble highs (mostly made back in 2005 and 2006).Quite a few cities now have home prices that are well above their prior highs from the mid-2000s bubble. Denver and Dallas are up the most at more than 40%+ from their prior bubble highs, while Seattle and Portland are both roughly 20% above mid-2000s peak levels.
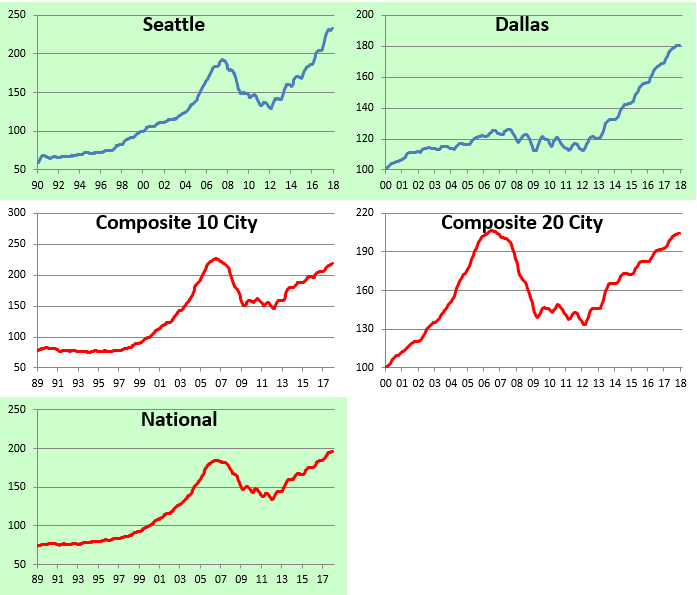
At the national level, home prices have now eclipsed their housing bubble highs by 6%, but both the composite 10-city and composite 20-city indices are still just a hair below their highs.
Los Angeles and San Diego are the two closest cities to making new all-time highs, while Las Vegas, Phoenix, Miami, and Chicago have the furthest to go.
(Click on image to enlarge)
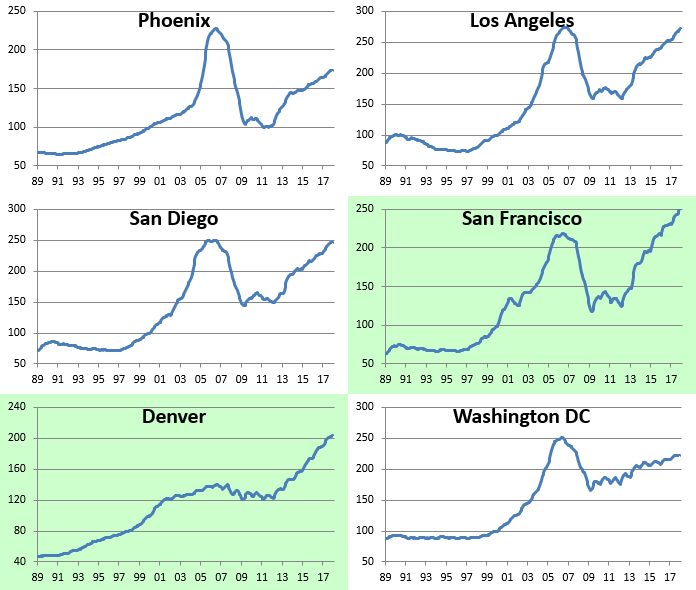
Below we provide historical home price charts for each of the cities tracked by S&P/Case-Shiller. Cities highlighted in green have all traded to new all-time highs during the current expansion.
(Click on image to enlarge)
(Click on image to enlarge)
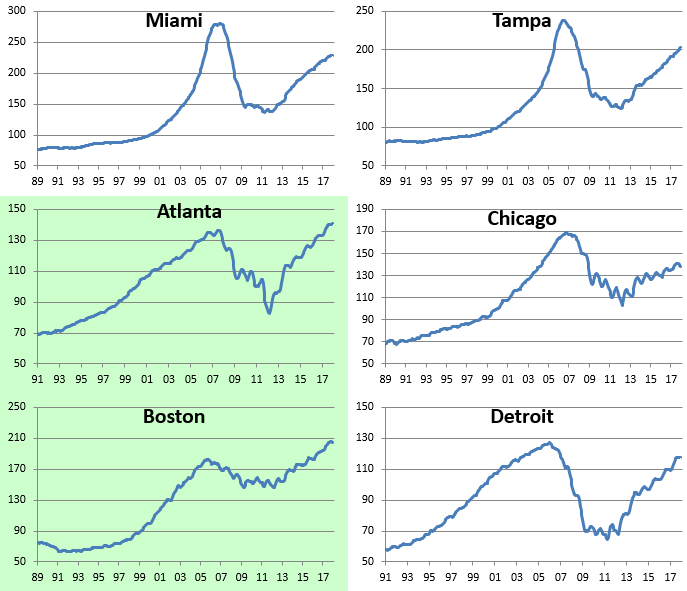
(Click on image to enlarge)
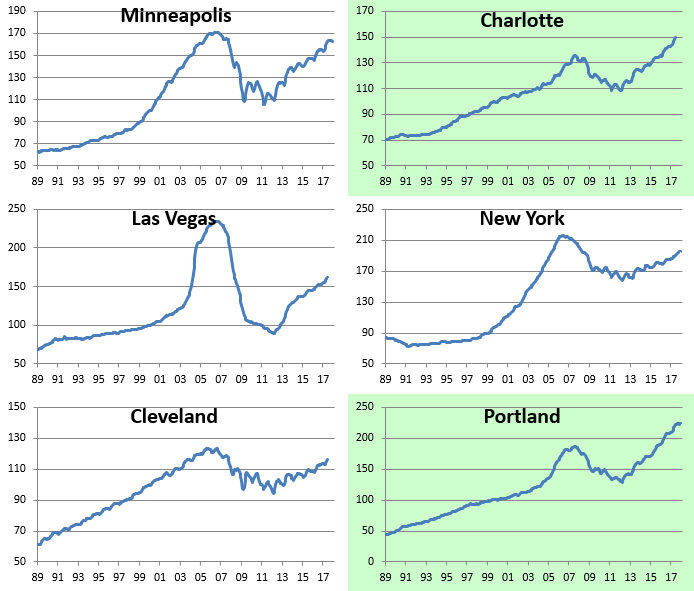
(Click on image to enlarge)



Comments
Log in or sign up to join the conversation.