

A quick update on Tesla (TSLA) which has continued to struggle since my 2nd February post the extent of which we can see on the annotated daily chart. I have also included the weekly chart for downside levels likely to be tested. The good news is these look robust.
(Click on image to enlarge)
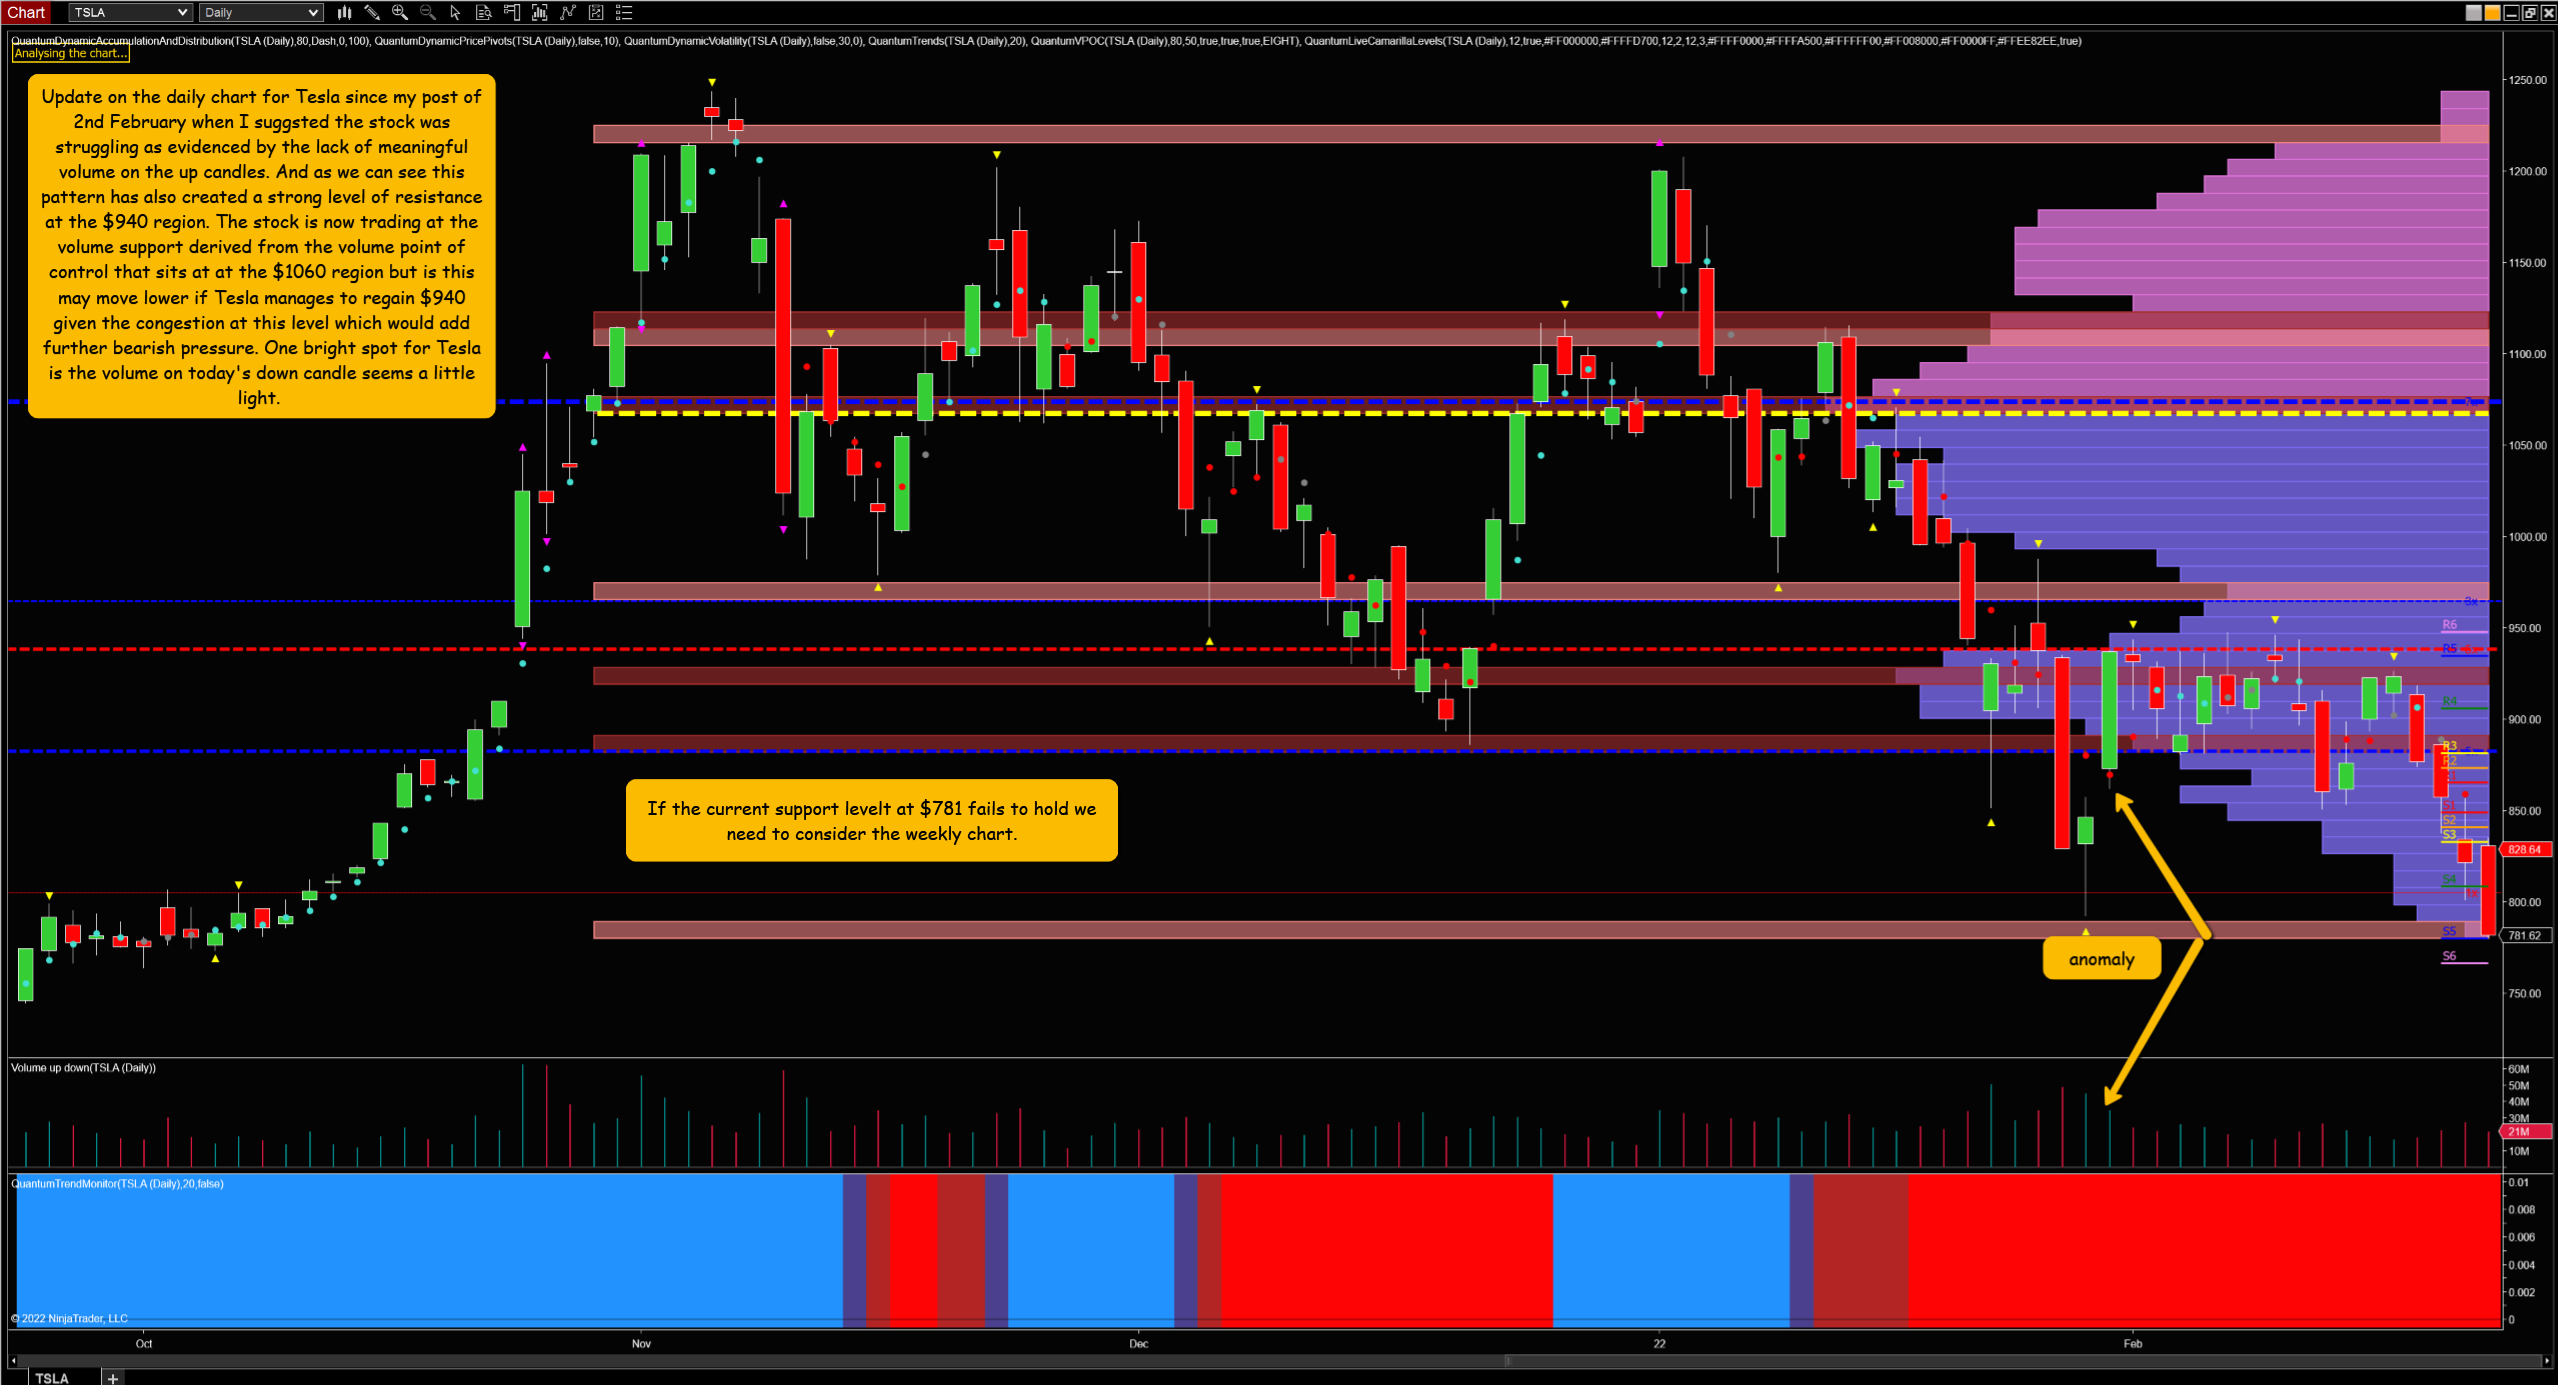
In addition, we also need to wait until Friday’s close before we can make a meaningful assessment of the price/volume relationship.
(Click on image to enlarge)
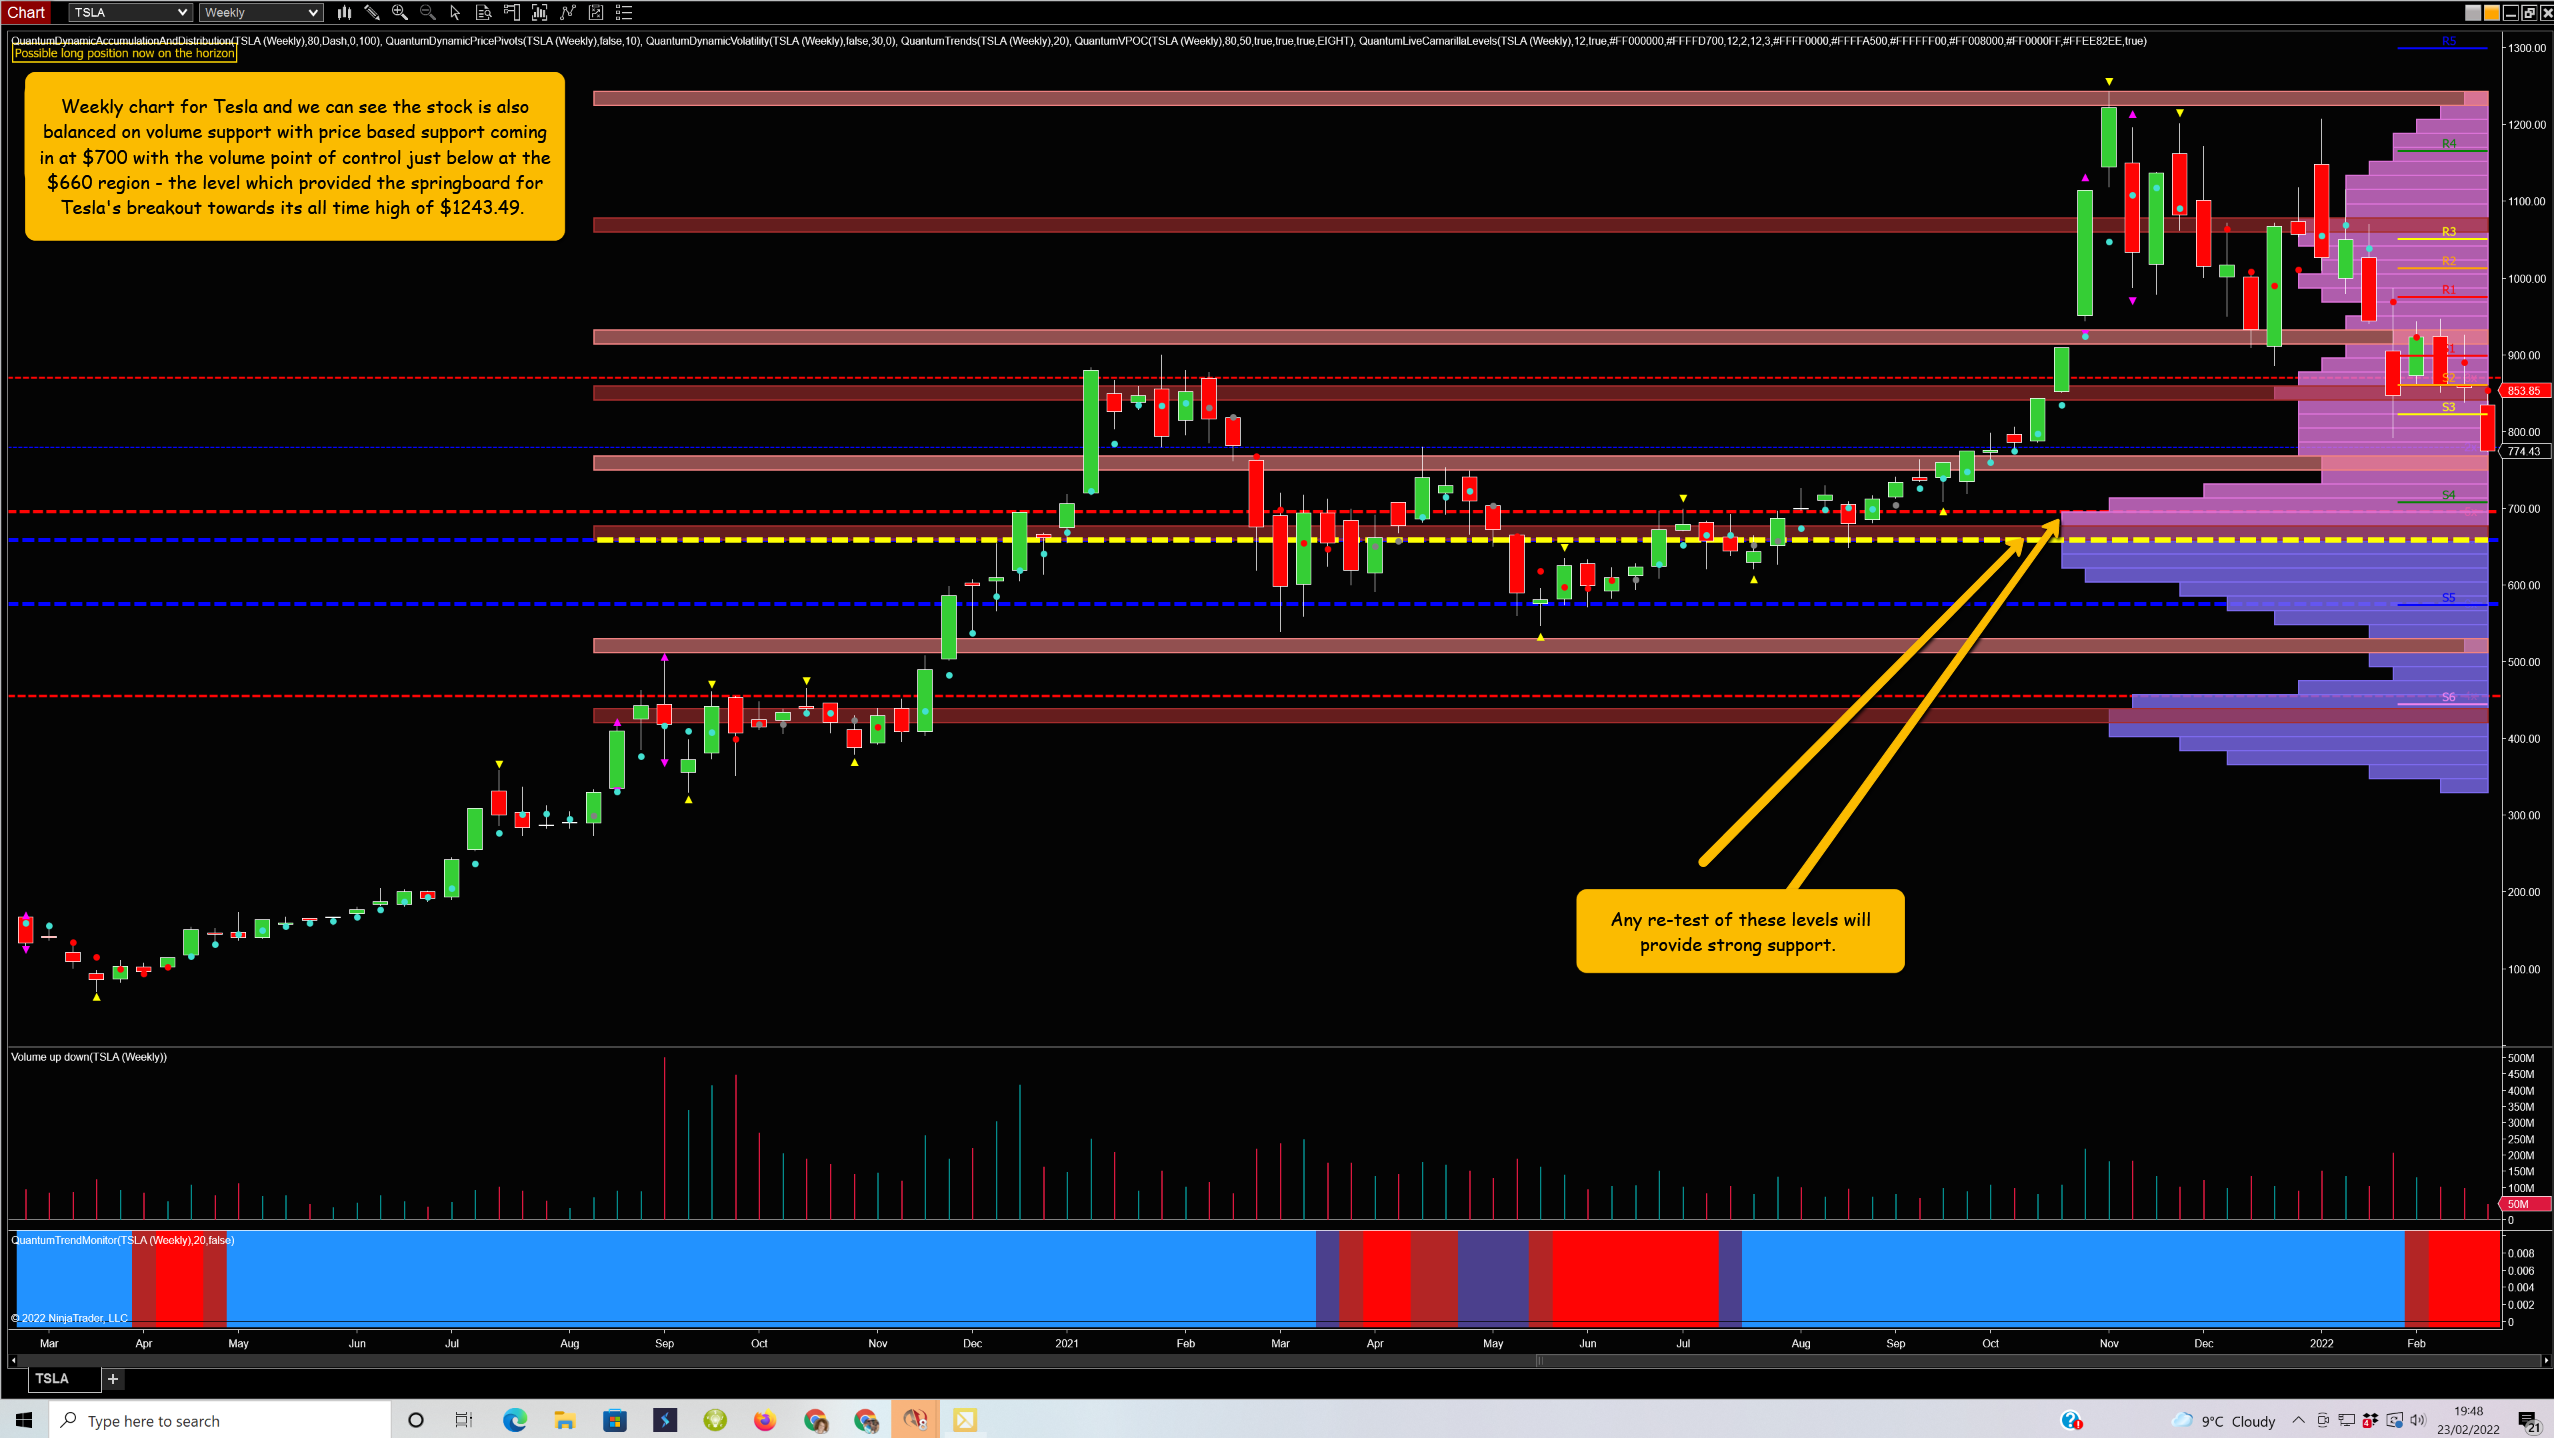
Charts from Ninjatrader and the accumulation and distribution indicator is my own and available from Quantumtrading


Comments
Log in or sign up to join the conversation.