

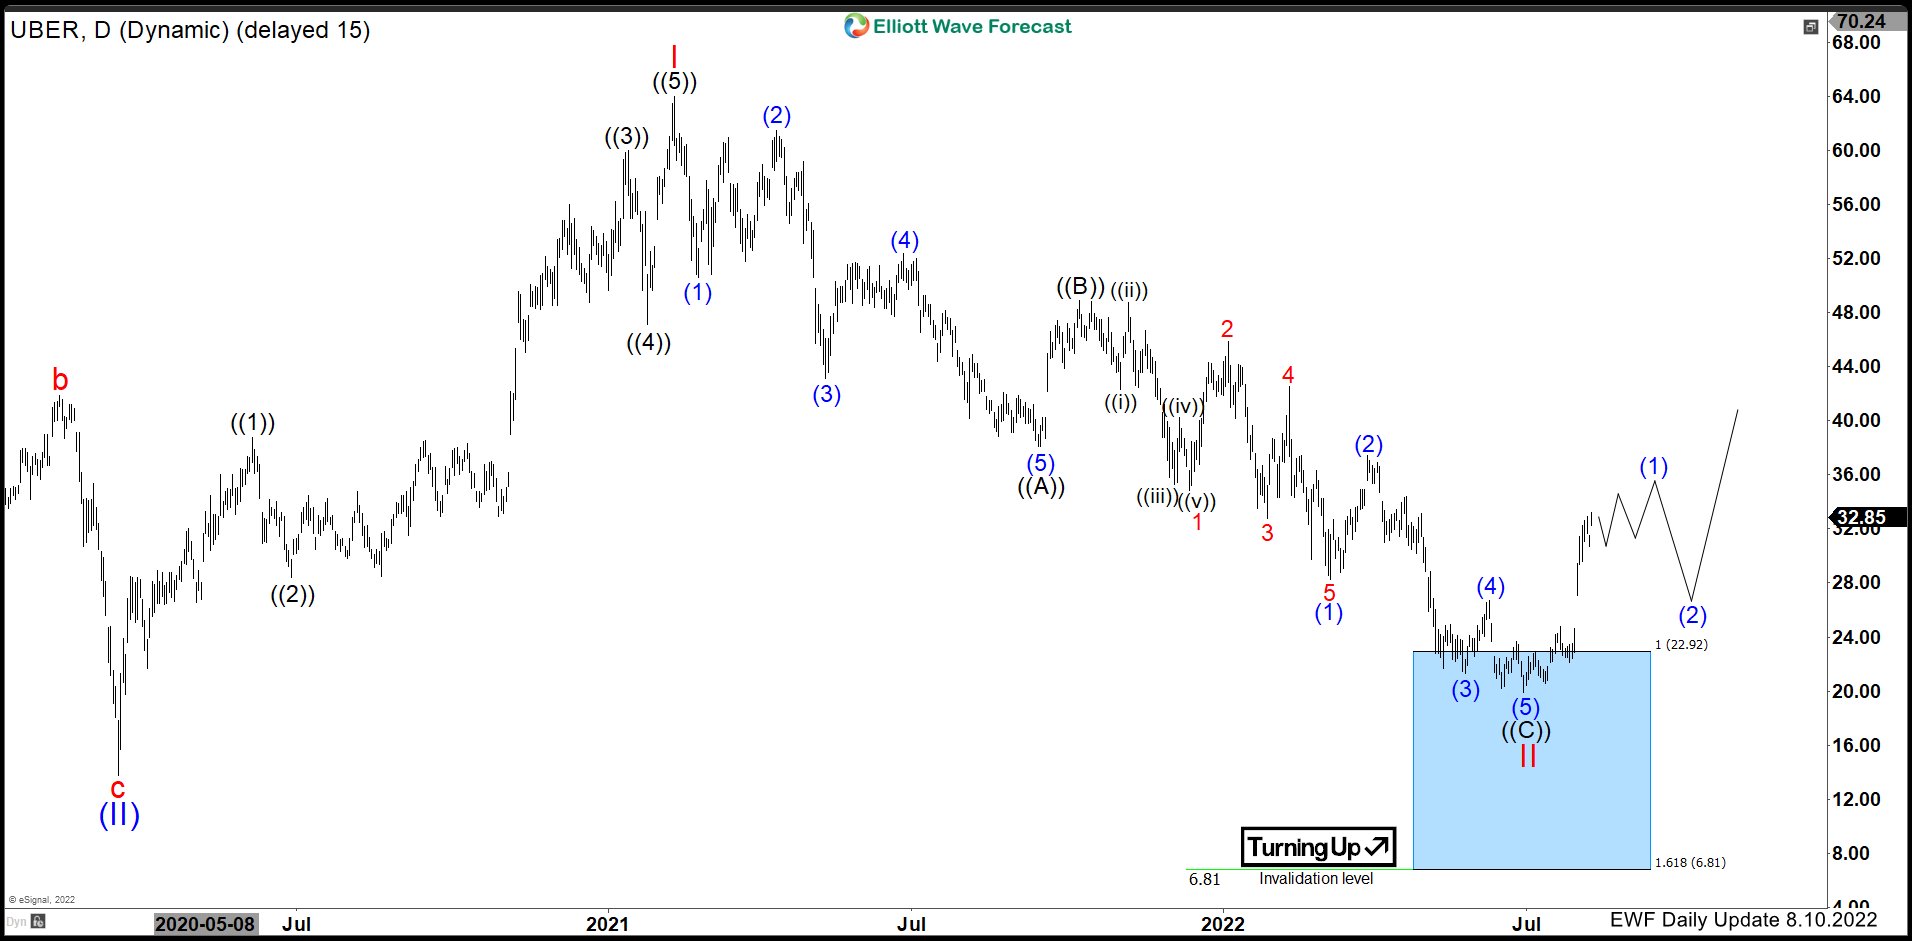
Hello Traders. In today’s article, we are going to follow up on Uber Technologies Inc. ($UBER) forecast posted back in August 2022 and take a look at the latest count. You can find the article here.
$UBER Daily Elliott Wave View Aug 2022:
Third Wave Extension

Different Types of Wave Extensions
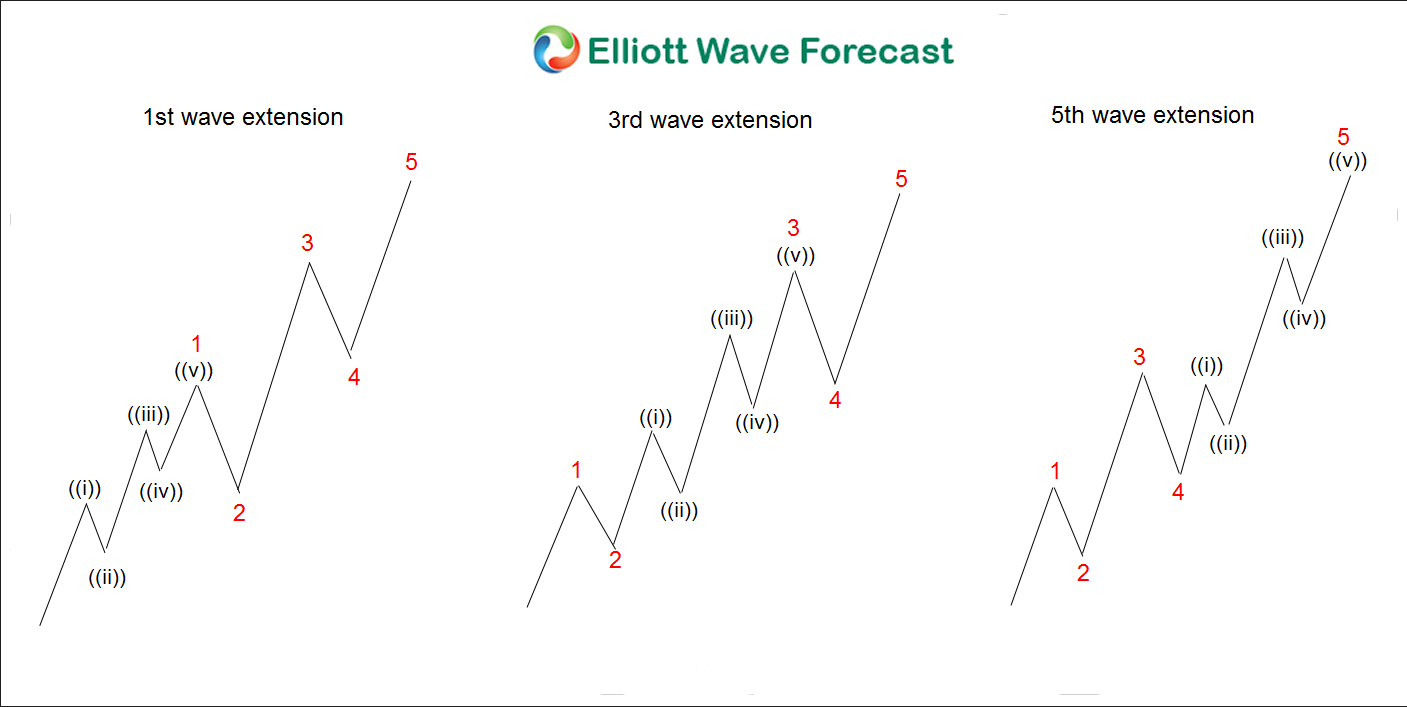
The overall structure looks like a nest. A nest is a series of 1-2. Most of the time a nest happens before a huge move takes place. The chart above shows what a nest looks like.
$UBER Latest Elliott Wave View Dec 2023:
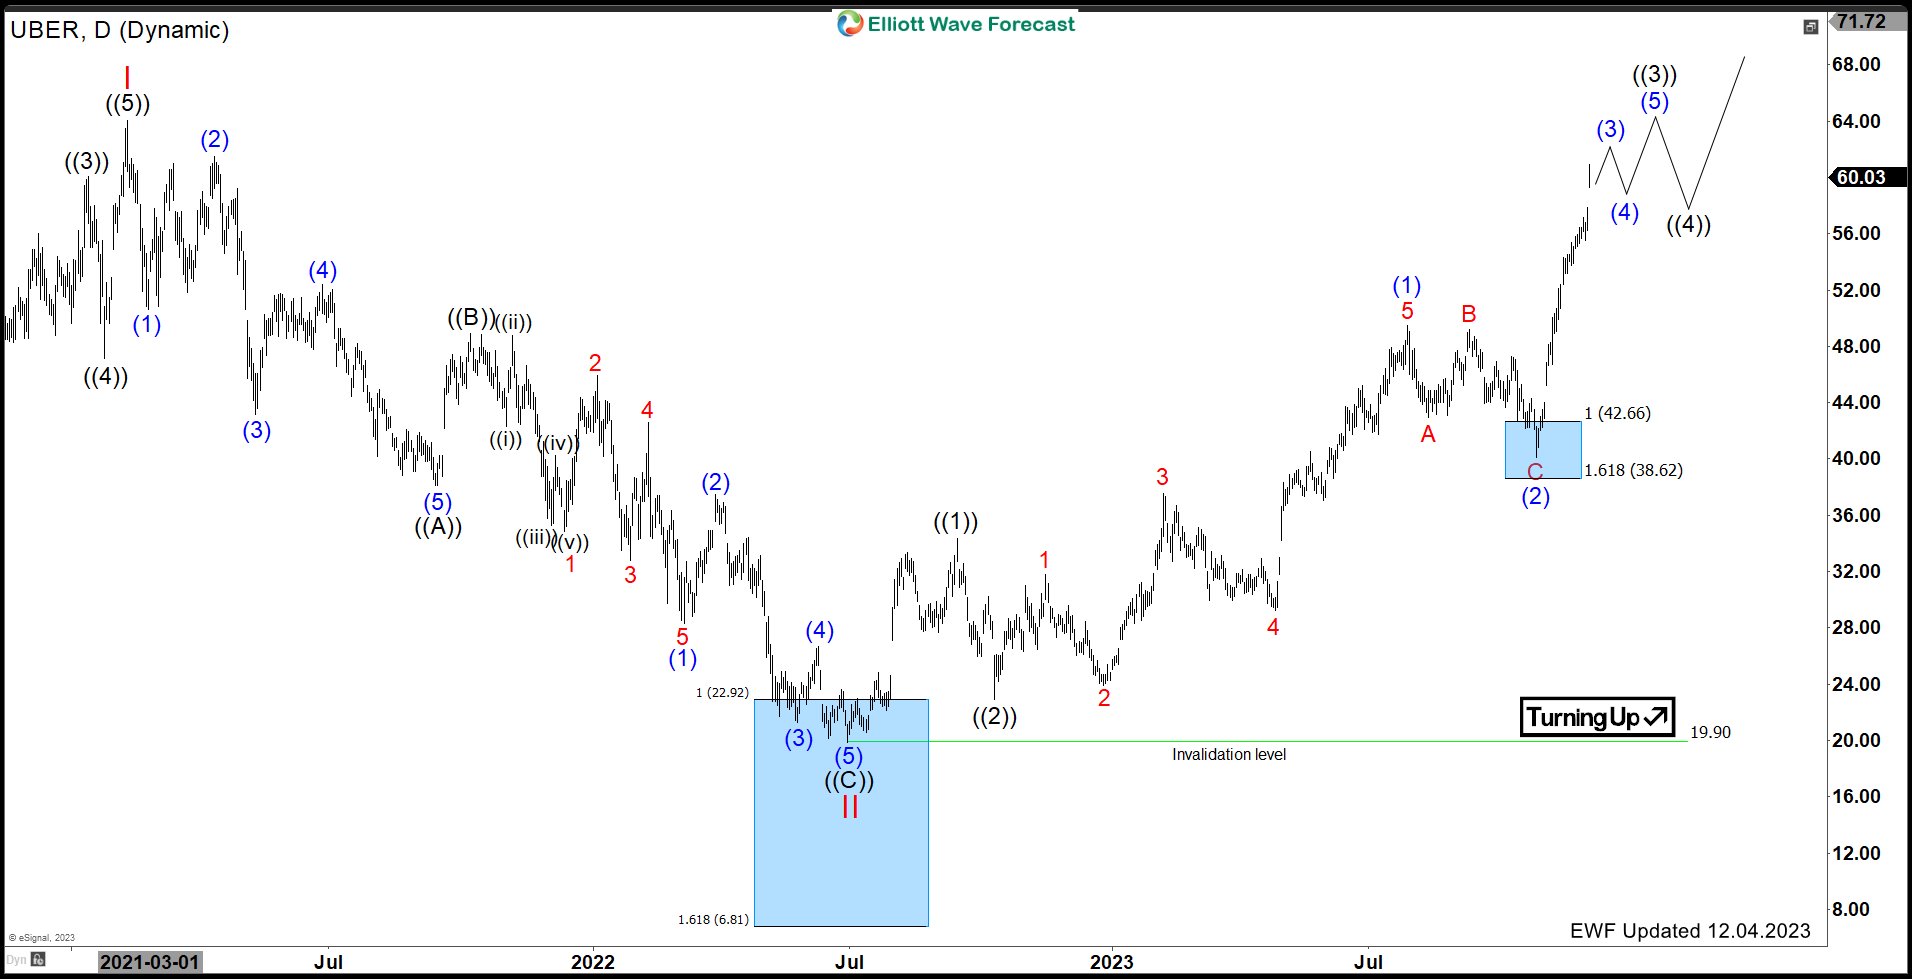 The Daily Chart above shows the cycle from June 2022 low unfold in a 5 waves nesting structure. Every 5 wave advance was followed by a 3 swing pullback that was met with buyers. The last 3 swing pullback that took place in July - Oct 2023 managed to reach a blue box area at $42.66 - 38.62. The reaction from there has erased divergence in all timeframes making it the wave 3 of 3 of the nest. The stock is expected to remain supported in a series of 4s and 5s and break above the All Time Highs with a target higher towards $70 - 88 before the cycle from June 2022 low ends. Once that cycle ends, we expect the pullback to correct June 2022 to also find buyers again in 3 or 7 swings in the future.



Comments
Log in or sign up to join the conversation.