

Alphabet Inc. (GOOGL) – Elliott Wave Analysis
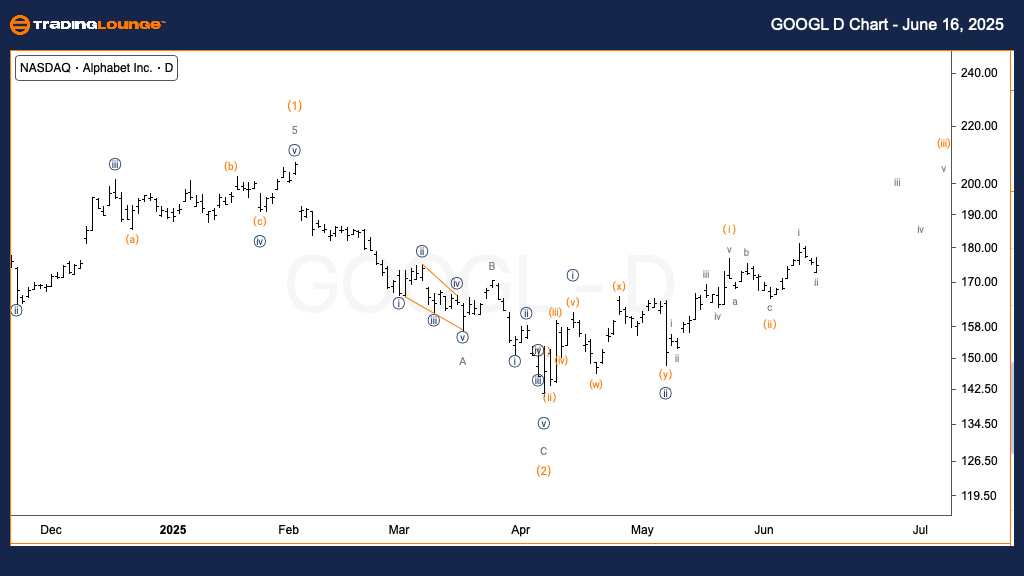
Daily Chart
Mode: Impulsive
Structure: Motive
Position: Wave ii of (iii)
Direction: Upside into wave (iii)
This daily chart analysis reflects a bullish bias, indicating wave ii of (iii) is nearing completion with potential for acceleration into wave (iii). A nested structure from April lows supports continued upward action. An alternate scenario sees a completed flat correction forming wave {c} of B. Strong price momentum will confirm the bullish count.
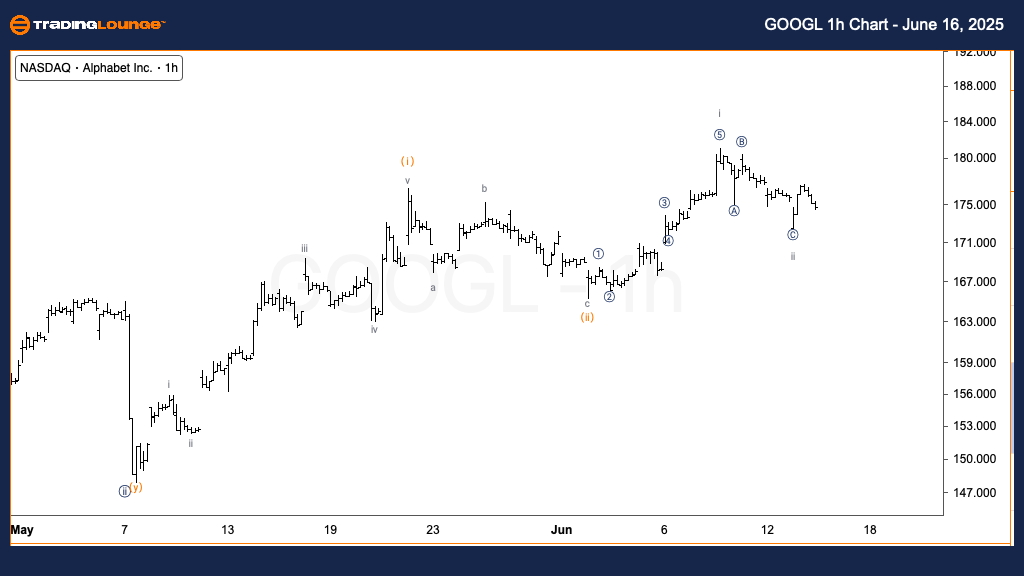
1H Chart
Mode: Impulsive
Structure: Motive
Position: Wave ii of (iii)
Direction: Formation of wave iii
Short-term structure shows wave ii potentially complete, with wave iii likely to extend higher. A confirmed breakout above Minor Group 2 will validate this view, indicating a fresh impulsive leg upward.
Technical Analyst: Alessio Barretta
More By This Author:
Elliott Wave Technical Analysis: Natural Gas - Monday, June 16
Elliott Wave Technical Analysis: New Zealand Dollar/U.S. Dollar - Monday, June 16
VeChain Crypto Price News Today - Monday, June 16



Comments
Log in or sign up to join the conversation.