
Oil eases on Israel-Lebanon ceasefire, but inventories are falling rapidly
Oil prices are easing on Thursday, snapping a two-day winning streak, as the ceasefire agreement between Israel and Lebanon raises hopes that a broader deal to end the conflict in the Middle East could eventually be reached.
However, the pullback appears to reflect profit-taking rather than any meaningful improvement in the supply outlook. The ongoing stalemate in U.S.-Iran diplomatic talks, together with renewed hostilities in the region, including Iranian attacks on Kuwait and U.S. military strikes near the Strait of Hormuz, continues to highlight the risk of further escalation.
The Republican-led U.S. House of Representatives approved a resolution seeking to block President Trump from continuing military action against Iran. However, the measure would still require Senate approval and a two-thirds majority in both chambers to override an expected presidential veto, making any immediate policy shift unlikely.
While President Trump continues to suggest progress in negotiations with Iran, messaging from Tehran has been considerably less optimistic, highlighting the significant gap between the two sides.
For oil markets, the key issue is not whether talks continue, but whether they result in a meaningful increase in supply. Until there is evidence that shipping flows through the Strait of Hormuz are normalising, traders are likely to continue pricing in a geopolitical risk premium.
Meanwhile, U.S. crude inventories fell by 8 million barrels to 443.7 million barrels in the week ending May 29, according to EIA data. This was significantly larger than expectations for a 4 million barrel draw. Global crude inventories continue to decline, reducing the market's buffer, leaving prices increasingly sensitive to any further escalation in the region.
As a result, the oil market remains heavily dependent on developments in the Middle East. Many industry analysts have warned that if the Strait of Hormuz remains largely closed through July, oil prices could move significantly higher as inventories continue to tighten and spare capacity is lost.
Even if the Strait were to reopen, prices may not immediately return to pre-conflict levels, given the need to rebuild depleted inventories, which will keep demand elevated and support crude prices even after supply disruptions begin to ease.
The market appears to be pricing a partial resolution to the conflict rather than a full normalisation of oil flows. Until there is clear evidence that exports through the Strait are returning to normal levels, any downside in crude prices could remain limited.
Oil forecast – technical analysis
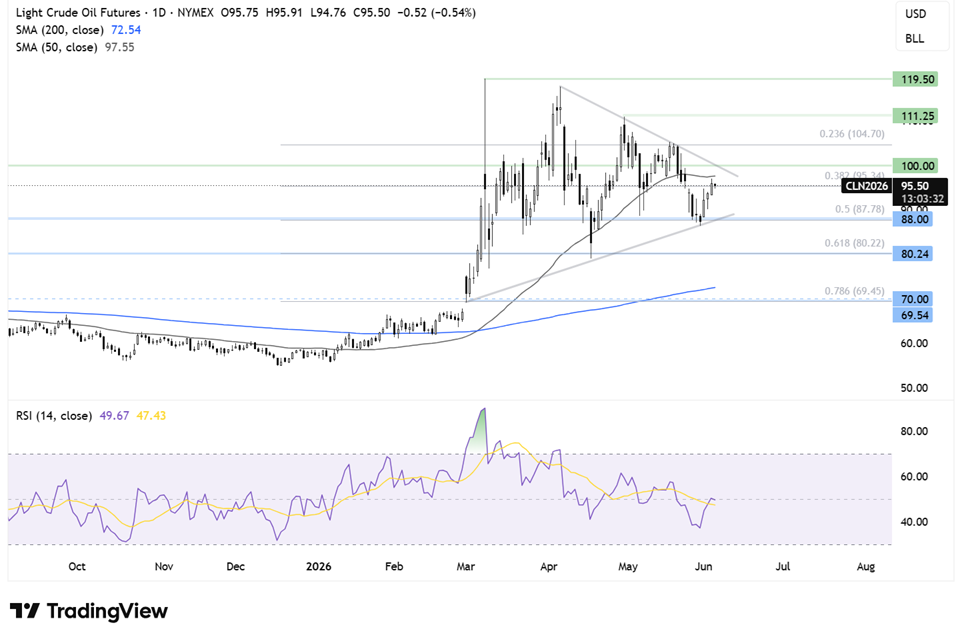
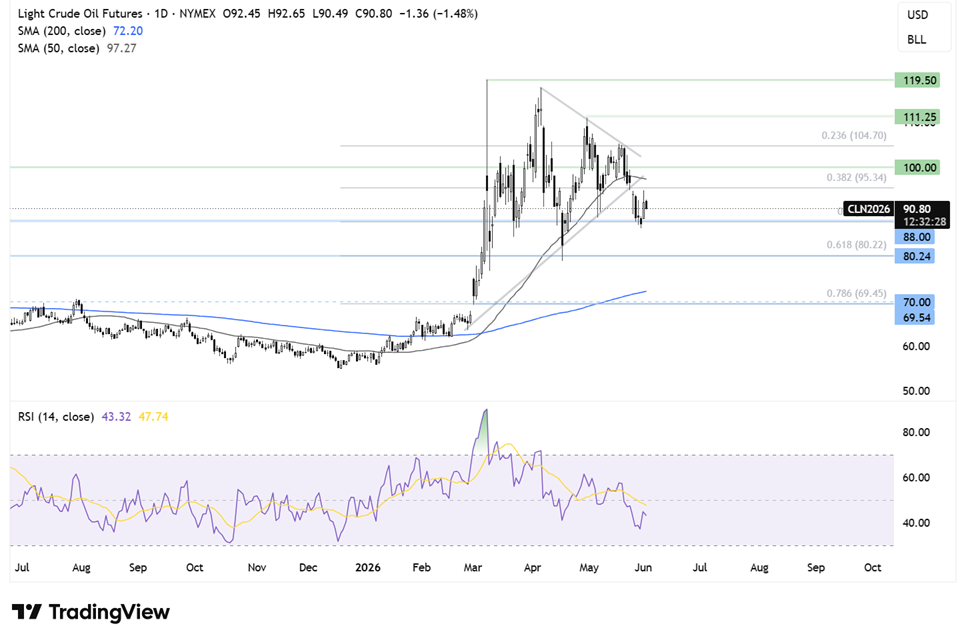
Oil trades within a symmetrical triangle pattern. The price has recently recovered from the rising trendline support at 86.35 and has run into resistance around the 95 level, the 38% fib retracement of the 55 low to 120 high. The price also remains below the 50 SMA.
Buyers would need to retake 100, the falling trendline resistance and a psychological level, to push ahead towards 105, the mid-May swing high, and the 23.6% Fib retracement level.
Failure to take 95 and 50 SMA could see the price fall back towards the 88, the rising trend line support, and the 50% retracement. A break below here creates a lower low, opening the door to 80, 61.8 fib retracement, and the round number.
GBP/USD steady amid US-Iran stalemate & ahead of BoE Bailey’s speech
GBP/USD is little changed as investors remain focused on the conflict in the Middle East and the potential economic and monetary policy implications of a prolonged war.
While the ceasefire agreement between Israel and Lebanon has prompted some profit-taking in the USD, ongoing hostilities between the U.S. and Iran, together with the continued diplomatic stalemate, suggest any downside in the greenback could be limited.
Attention is now turning to U.S. jobless claims, which are expected to edge lower to 213k from 215k previously. However, the main focus will be Friday's non-farm payroll report. Expectations are for 85k jobs to have been added in May, down from 115k in April.
That said, recent labour market indicators have been more encouraging. ADP payrolls and JOLTS job openings both surprised to the upside this week, suggesting that hiring demand remains relatively resilient despite the backdrop.
Strong U.S. data, combined with persistent inflation pressures, would reinforce the view that the Federal Reserve could keep interest rates higher for longer, which remains supportive of the USD.
Meanwhile, the UK economy remains vulnerable to elevated energy prices. While oil and gas prices have eased from their late-April highs, they remain significantly above pre-conflict levels. If energy prices remain elevated, they could add to inflationary pressures and weigh on growth, creating a difficult backdrop for the Bank of England. Yesterday’s PMI data highlighted the stagflationary impact, with the composite PMI falling to 49.7 in May, into contraction territory.
Investors believe the BoE can wait before hiking rates. Money markets are not fully pricing a 25-basis-point rate hike until September and currently expect fewer than two rate increases before the end of the year.
Attention will be on comments from Bank of England Governor Andrew Bailey later today for further clues on how policymakers are assessing the inflation outlook and the impact of higher energy prices on the UK economy.
GBP/USD forecast - technical analysis
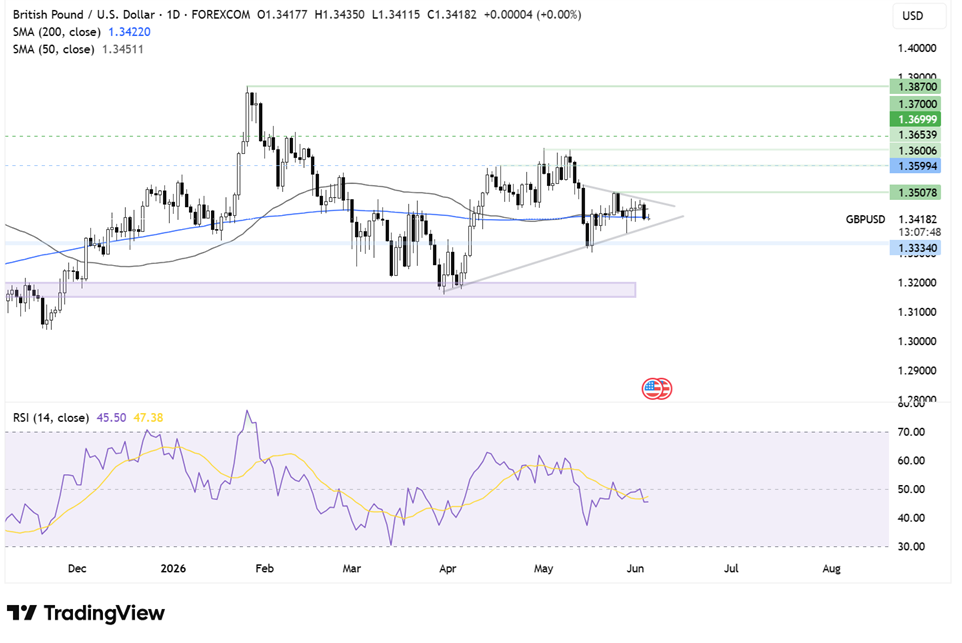
GBP/USD trades within a symmetrical triangle pattern. The price has fallen below the 50 SMA and is testing the 200 SMA support around 134.20. The RSI has tipped below 50 as momentum slows.
Sellers will look to break below the 200 SMA and the rising trendline support (133.90), opening the door to the 133.40 support zone. A break below here opened the door to the 132 support zone and the 2026 low.
Buyers will need to recover above the 50 SMA at 134.50 and rise above the falling trendline resistance at 134.80 to break out of the symmetrical triangle to the upside, drawing attention to 136, the round number ahead of 136.50, the May high.
Comments
Log in or sign up to join the conversation.