
Oil falls after mixed messages from the US and Iran
Oil prices are falling after sharp gains in the previous session as traders weigh mixed signals surrounding U.S.-Iran negotiations aimed at ending the Middle East conflict.
WTI and Brent are both trading around 1% lower, with Brent slipping back towards $91 a barrel after surging more than 4% on Monday.
Oil continues to trade almost entirely on geopolitical headlines, with the market trying to assess whether the latest setbacks in negotiations represent a temporary obstacle or a sign that a broader agreement remains some way off.
Comments from President Trump that talks with Iran are continuing helped ease some concerns after reports that Tehran had suspended negotiations triggered a sharp rally in crude prices yesterday. The reaction highlights just how sensitive oil remains to developments in the Middle East, with traders quick to reprice supply risks whenever tensions escalate.
For now, the market appears to be pricing a partial resolution rather than a full normalisation of supply flows. Traders are looking for evidence of tangible progress, particularly signs that tanker traffic can resume through the Strait of Hormuz, rather than relying solely on political rhetoric.
Lebanon's announcement of a partial ceasefire between Hezbollah and Israel following a limited escalation has also helped support hopes that tensions across the region may not broaden further. However, the situation remains fragile, and the risk of renewed disruption remains elevated.
Meanwhile, the continued closure of the Strait of Hormuz has reshaped global oil flows. U.S. crude exports climbed to a record 5.6 million barrels per day in May as buyers sought alternative sources of supply. This suggests the market is adapting to the disruption, although at a higher cost.
Attention is also turning to inventory data. U.S. crude stockpiles are expected to have fallen by around 3.6 million barrels in the week ending May 29, extending the previous week's drawdown. A further decline would point to resilient demand despite elevated prices and could help limit the downside in crude even if geopolitical tensions ease.
Headlines surrounding the Middle East are likely to remain the dominant driver of oil prices in the near term. However, while oil has fallen significantly from the $120 peak seen in March, prices remain well above the roughly $60-a-barrel level that prevailed before the conflict began. That suggests the market is still pricing a meaningful geopolitical risk premium, despite recent optimism surrounding negotiations.
Oil forecast – technical analysis
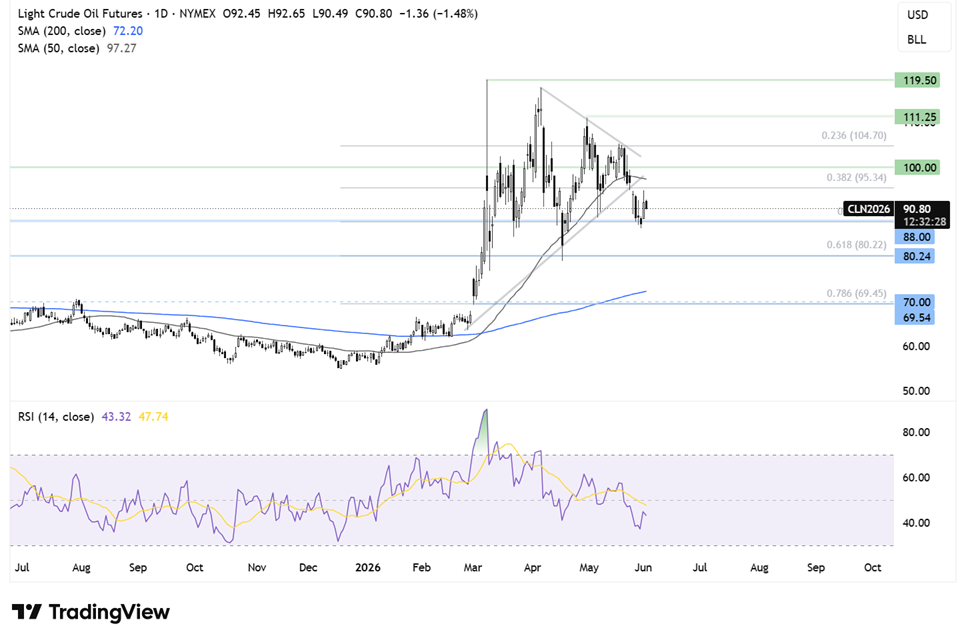
Oil broke out of the symmetrical triangle pattern, falling to the 88 support zone, which coincides with the 50% Fibonacci retracement of the 55 low to the 120 high. The rebound from this level failed to reclaim 95, the 38.2% Fibonacci retracement level, and the price is once again easing back towards 88.
Sellers, supported by the breakdown from the symmetrical triangle and the RSI remaining below 50, will look for a break below the 88 support zone to bring 80 into focus, the 61.8% Fibonacci retracement level.
Should the 88 support hold, buyers will look to rise above 95, the 38.2% Fibonacci retracement level, and the 50 SMA at 97 to bring 100, the psychological level, into focus. It would take a rise above 105, the 23.6% Fibonacci retracement level, to create a higher high and shift the broader structure back in favour of the bulls.
EUR/USD rises after hotter Eurozone inflation & amid a weaker USD
EUR/USD is rising towards 1.1650 after stronger-than-expected Eurozone inflation data, while easing oil prices are helping to improve risk sentiment.
Eurozone inflation rose to 3.2% year-on-year in May, up from 3.0% in April and in line with expectations. Meanwhile, core inflation, which strips out more volatile items such as food and energy, accelerated to 2.5% from 2.2%, coming in above forecasts.
The data come ahead of the ECB's June 11 meeting and reinforce expectations that policymakers will deliver a 25-basis-point rate hike, taking the deposit rate to 2.25%. The move is already fully priced into the market.
However, while higher inflation strengthens the case for further policy tightening, it also highlights the difficult balancing act facing the ECB. Growth across the Eurozone remains sluggish, and higher borrowing costs risk adding further pressure to an already fragile economy. As a result, the inflation data may support the euro in the near term, but could become a headwind if tighter policy starts to weigh more heavily on growth.
The U.S. dollar is trading in a relatively tight range against its major peers as investors continue to monitor developments in the Middle East and look ahead to key economic data later in the week.
Any signs of progress towards a peace deal between the U.S. and Iran could reduce safe-haven demand for the dollar and support risk-sensitive currencies such as the euro.
Yesterday, President Trump said talks with Iran were continuing despite reports that Tehran had suspended indirect negotiations, highlighting the uncertainty surrounding the outlook for the conflict.
Alongside developments in the Middle East, investors are also looking ahead to Friday's non-farm payroll report. Expectations are for around 85,000 jobs to have been added in May, which would point to a cooling labour market.
Before then, JOLTS job openings data are due later today and are expected to show vacancies remained broadly unchanged at 6.87 million.
Meanwhile, data released yesterday showed that the U.S. ISM Services PMI rose to 54.0 in May from 52.7 previously, beating forecasts of 53.0 and marking the strongest reading since May 2022. The data suggest that despite concerns over higher interest rates and geopolitical uncertainty, activity in the services sector remains resilient, which could support the Fed's higher-for-longer stance on rates.
EUR/USD forecast – technical analysis
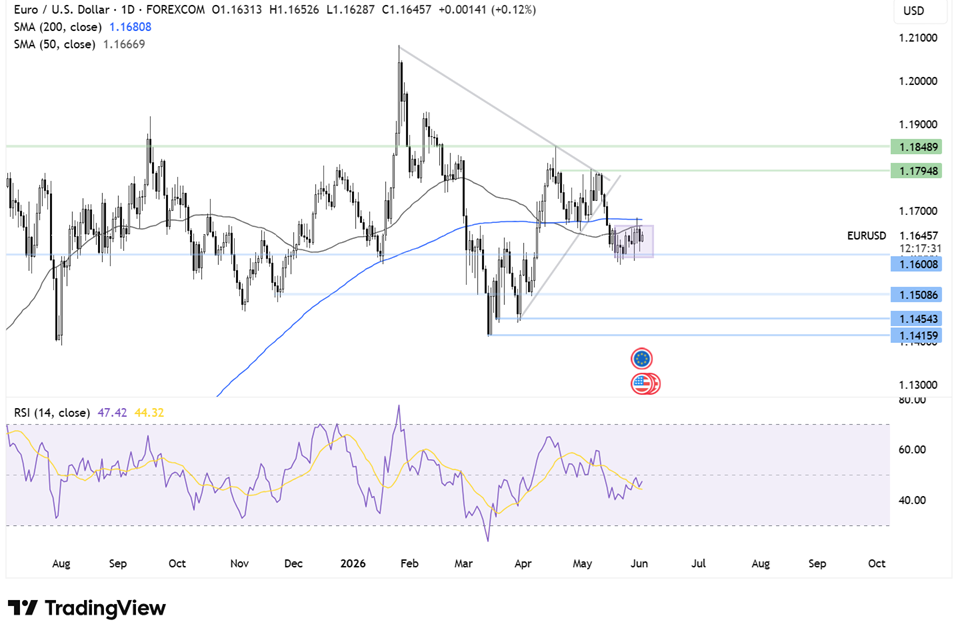
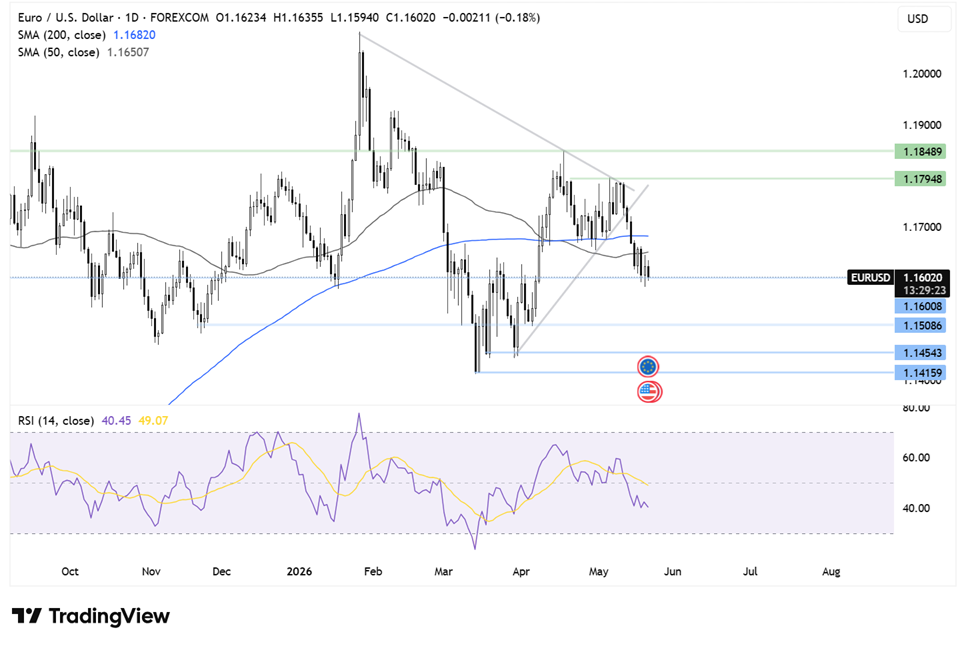
EUR/USD broke out of the symmetrical triangle pattern before finding support at 1.1600. The price is now consolidating in a narrow range, capped by the 50 SMA at 1.1670 on the upside and supported by 1.1600 on the downside. The RSI is close to neutral, suggesting a lack of clear directional momentum in the near term.
As the price trades towards the upper end of this holding pattern, buyers will need to rise above 1.1670, the 50 SMA, and 1.1680, the 200 SMA, to break out to the upside and bring 1.1800 into focus.
On the downside, sellers will look for a break below 1.1600, which could open the door to 1.1500, the April low. Below here, attention turns to 1.1450, the late-March swing low.
Comments
Log in or sign up to join the conversation.