

Image Source: Pixabay
GBP/USD slips after weak UK growth & strong US jobs data
GBP/USD is slipping lower after Q4 UK growth disappointed, amid shrinking business investment and a stagnant service sector. The weak figures add pressure to struggling Prime Minister Keir Starmer.
GDP rose 0.1% QoQ following growth of 0.1% in Q3 and falling short of 0.2% forecasts. On a monthly basis, GDP rose just 0.1% in December.
Delving deeper into the figures, the dominant service sector stagnated, with 0% growth; consumer spending remained tepid at just 0.2%; and business investment shrank by 2.7%, marking the steepest decline since 2021. Meanwhile, government spending did most of the heavy lifting in the quarter.
Other data points released were also disappointing, with industrial production falling 0.9% in December, and manufacturing production also lower than expected.
. These figures will do little to help Keir Starmer, who has been under pressure this week and is facing a challenge to his leadership.
Overall, the economy ended 2025 in the slow lane, below expectations, as businesses and consumers digested the November budget. The data follow the Bank of England's downgrading of this year's growth forecast to 0.9% from 1.2%. The central bank also expects unemployment to rise more than previously thought.
The market is pricing in 1 full rate cut and an 80% chance of a second this year.
Meanwhile, the US dollar is rising, extending gains, supported by the strong nonfarm payrolls report, which has led investors to push back expectations of a Federal Reserve rate hike.
Attention will turn to today's jobless claims ahead of CPI data tomorrow.
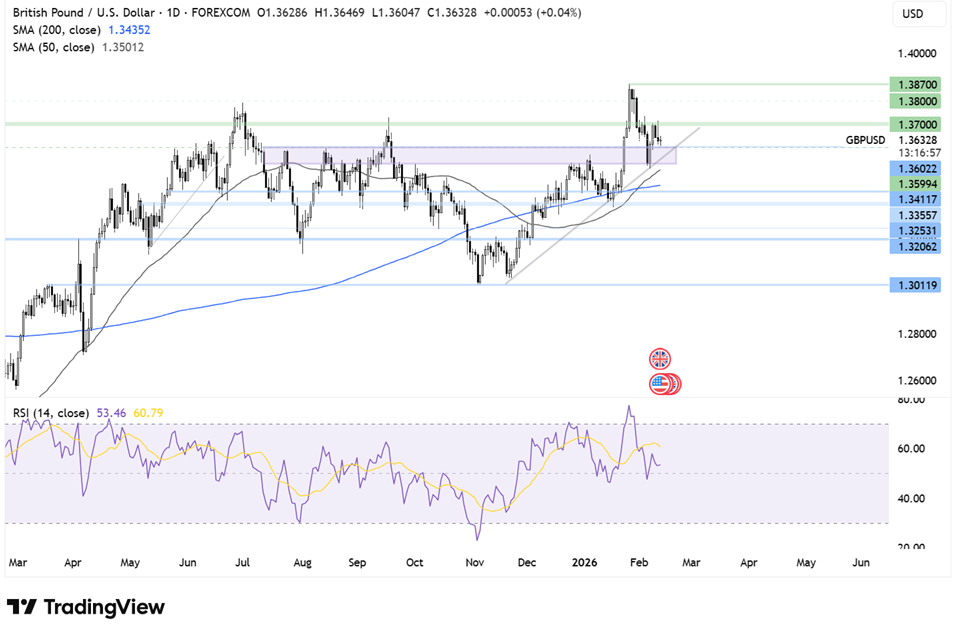
GBP/USD technical analysis
GBP/USD trades above its rising trendline, recovering from 1.30 to a high of 1,3870 before easing back below 1.37. The recent recovery from the rising trendline support failed to retake 1.37 but continues to hold above 1.36.
Buyers will need to rise above 1.37 to extend the bullish trend and bring the 1.38 round number and 1.3870, the 2026 high, into focus.
On the downside, a break below 1.36 opens the door to the 1.35 February low. A break below here creates a lower low.
(Click on image to enlarge)
Gold slips after strong NFP pushes out Fed rate cut expectations
Gold is edging lower on Thursday, giving back some of yesterday's gains as investors lowered Fed rate cut expectations. Although losses are limited amid lingering safe-haven demand
The delayed January NFP report was stronger than expected, with strong job creation, falling unemployment, and higher wage growth, signalling a resilient labour market at the start of 2026.
The data reinforced the Federal Reserve's cautious stance, with traders pushing back expectations for the next 25-basis-point rate cut to July from June.
Attention will now turn to Friday's CPI data for further insight into the Fed's next move. Expectations are for inflation to cool slightly.
Safe-haven demand for precious metals remains in play amid ongoing tensions between the US and Iran. While both sides have touted some progress in nuclear talks held over the weekend, Washington is reportedly preparing to deploy a second aircraft carrier to the Middle East.
Other supportive factors include the central bank's persistent buying of the precious metal. China's central bank extended its gold buying spree for the 15th month in January, according to data from the People's Bank of China. The buying spree came even as gold prices reached record highs and amid orders to Chinese financial institutions to reduce exposure to US treasuries, supporting a de-dollarisation move.
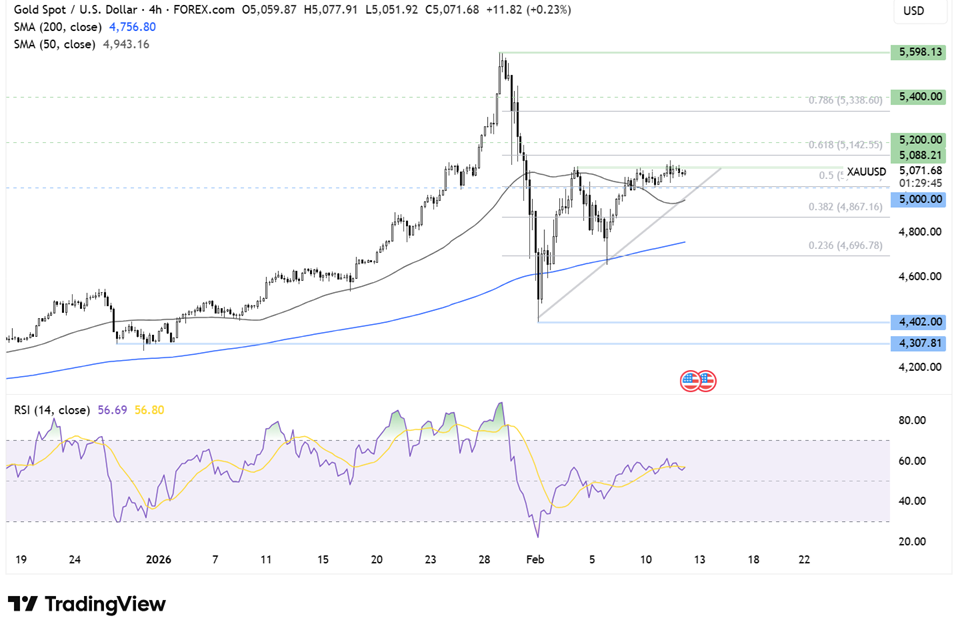
Gold forecast - technical analysis
XAU/USD trades above its rising trendline on the 4-hour chart. The price recently recovered from the 200 SMA support at 4655, extending its recovery above 5000, but has struggled at the 5090 resistance on several occasions.
Buyers would need to rise above the 5090 resistance to break out and bring 5140, the 61.8% Fib retracement of the 5598 high and 4400 low into focus ahead of 5340, the 78.6% Fib retracement.
Support is seen at 5000, the psychological level, and the 50% Fib level. A break below here exposes the 50 SMA at 4940 and the 4865 38.2% Fib level.
(Click on image to enlarge)
More By This Author:
Two Trades To Watch: USD/JPY, DAX Forecast - Wednesday, Feb. 11
Two Trades To Watch: GBP/USD, FTSE 100 Forecast
Two Trades To Watch: USD/JPY, EUR/USD Forecast - Monday, Feb. 9
Comments
Log in or sign up to join the conversation.