

Image Source: Pixabay
EUR/USD falls ahead of investor sentiment data, US factory orders. Oil rises towards $100 after losing 12% last week.
EUR/USD edging lower ahead of EZ investor confidence data
The EUR/USD is holding steady after a strong rally last week as Eurozone inflation hit 7.5% and US non-farm payrolls showed the labor market tightening.
The market mood remains cautious with more Russia Ukraine peace talks in focus.
Eurozone Sentix consumer sentiment data is due and is expected to fall again in April to -9.7 on rising uncertainty amid the ongoing war.
The USD is holding firm as treasury yields rise. US factory orders are due later today and are expected to show a decline to -0.6%, down from 1.4% in January.
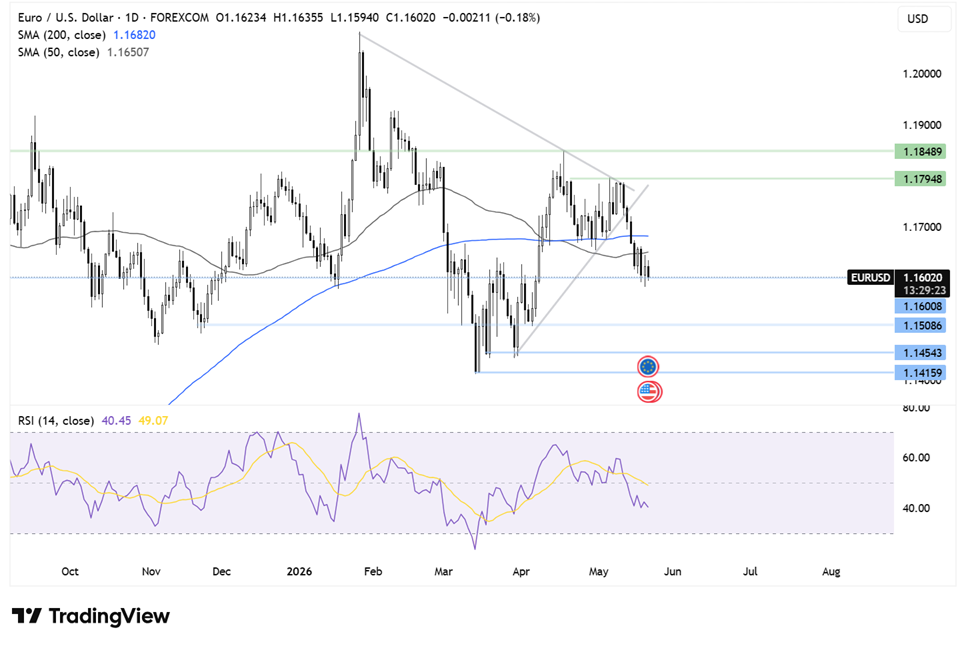
Where next for EUR/USD?
After failing to break above the 50 SMA at 1.1180 the price is extending its decline for a third straight session.
The pair trades caught between its 50 sma and its 20 sma, while the RSI is neutral, suggesting that the pair could be in a period of consolidation.
A breakout trade means buyers could look for a move above the 50 SMA at 1.1165 before bringing 1.1220, the December low, into play.
Sellers could look for a move below 1.1010 the 20 sma to bring 1.0950, last week’s low, into focus. A break below here could see a lower low formed.
(Click on image to enlarge)

Oil rises back towards $100
Oil prices fell over 12% last week after the US announced that it would release 1 million barrels per day across six months.
However, supply concerns persist as the market continues to fret over the absence of 1- 3 million barrels of Russian oil absent from the market each day.
China’s Shanghai has gone into total lockdown, raising some concerns over the demand outlook, which could limit the upside in oil for now.
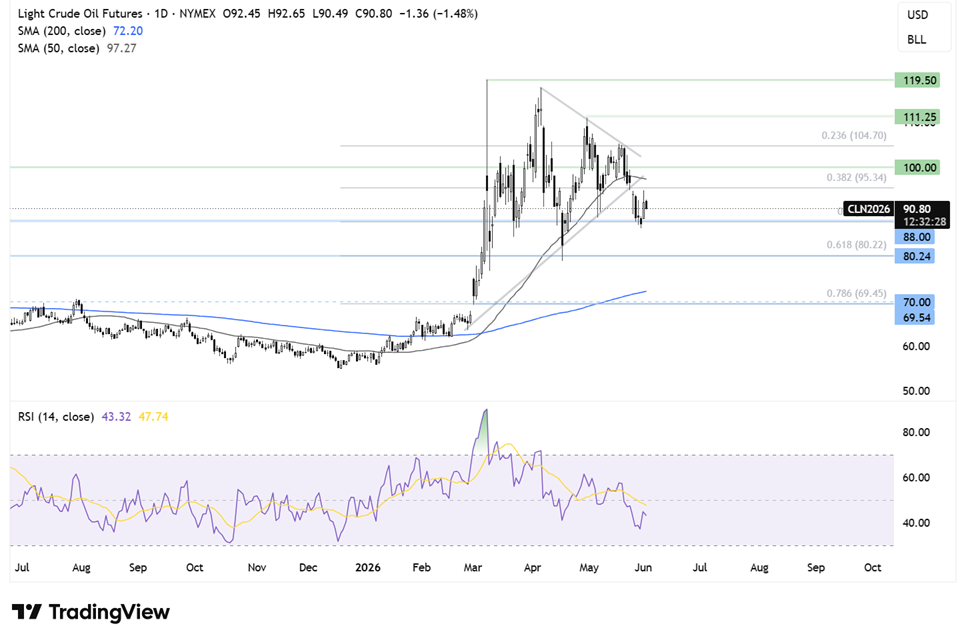
Where next for oil prices?
After running into resistance at 116.50, WTI crude oil formed a series of lower highs and lower lows last week, hitting support at 97.00, which acts as the near-term support.
The price has risen from there and is attempting to break back above its 50 sma, and rising trendline support turned resistance dating back to early December at 98.50
A meaningful move back over the trendline could bring resistance at 100.50, the February 24 high, into focus ahead of 103.95, the 20 sma, and 107.95, the March 30 high.
Failure to retake the trendline could see the price test 97.00 last week’s low, with a break below here creating a lower low and opening the door to 94.50, the February 14 high.
(Click on image to enlarge)

Comments
Log in or sign up to join the conversation.