

S&P/TSX Composite is a Canadian stock market index representing roughly 70% of the market capitalization on the Toronto Stock Exchange. Under the ticker $TSX, one can track the market value of 250 most important companies. From 2009 to 2020, TSX was a rather weak performer. While S&P500 has gained 410% during that period, TSX made an advance of only 140%. One of the reasons for this lagging behavior could be highly depressed commodity prices. As a matter of fact, Canadian companies are strongly represented in the oil, gas, metals, and mining industries. Hence, it is obvious that in a period of strong US dollar and low commodity prices, those companies could not rise significantly. Currently, commodity prices seem to turn higher which can give fuel for TSX for a long-expected rally.
TSX Weekly Elliott Wave Analysis 07.14.2020
The weekly chart below shows the S&P/TSX Composite Index. From March 2009 lows at 7408.9, the stock price has developed a cycle higher in wave I. It can be seen as a 3-3-3-3-3 Elliott Wave leading diagonal pattern. Waves ((1)) and ((4)) are overlapping in price which is a frequent feature of diagonal structures. Moreover, wave ((5)) demonstrates an RSI divergence with the wave ((3)). The 2009 cycle higher has ended by printing a high in February 2020 at 17970.5. This high has broken the 2007 highs opening up a weekly bullish sequence. Accordingly, while above 7408.9, pullbacks should find support in 3,7, 11 swings for more upside towards 22052-31093 area. From February 2020 highs, a sharp correction lower in wave II has retraced a big part of the cycle higher in wave I. It has found a bottom in March 2020 at 11144.6.
(Click on image to enlarge)

TSX Daily Elliott Wave Analysis 07.14.2020
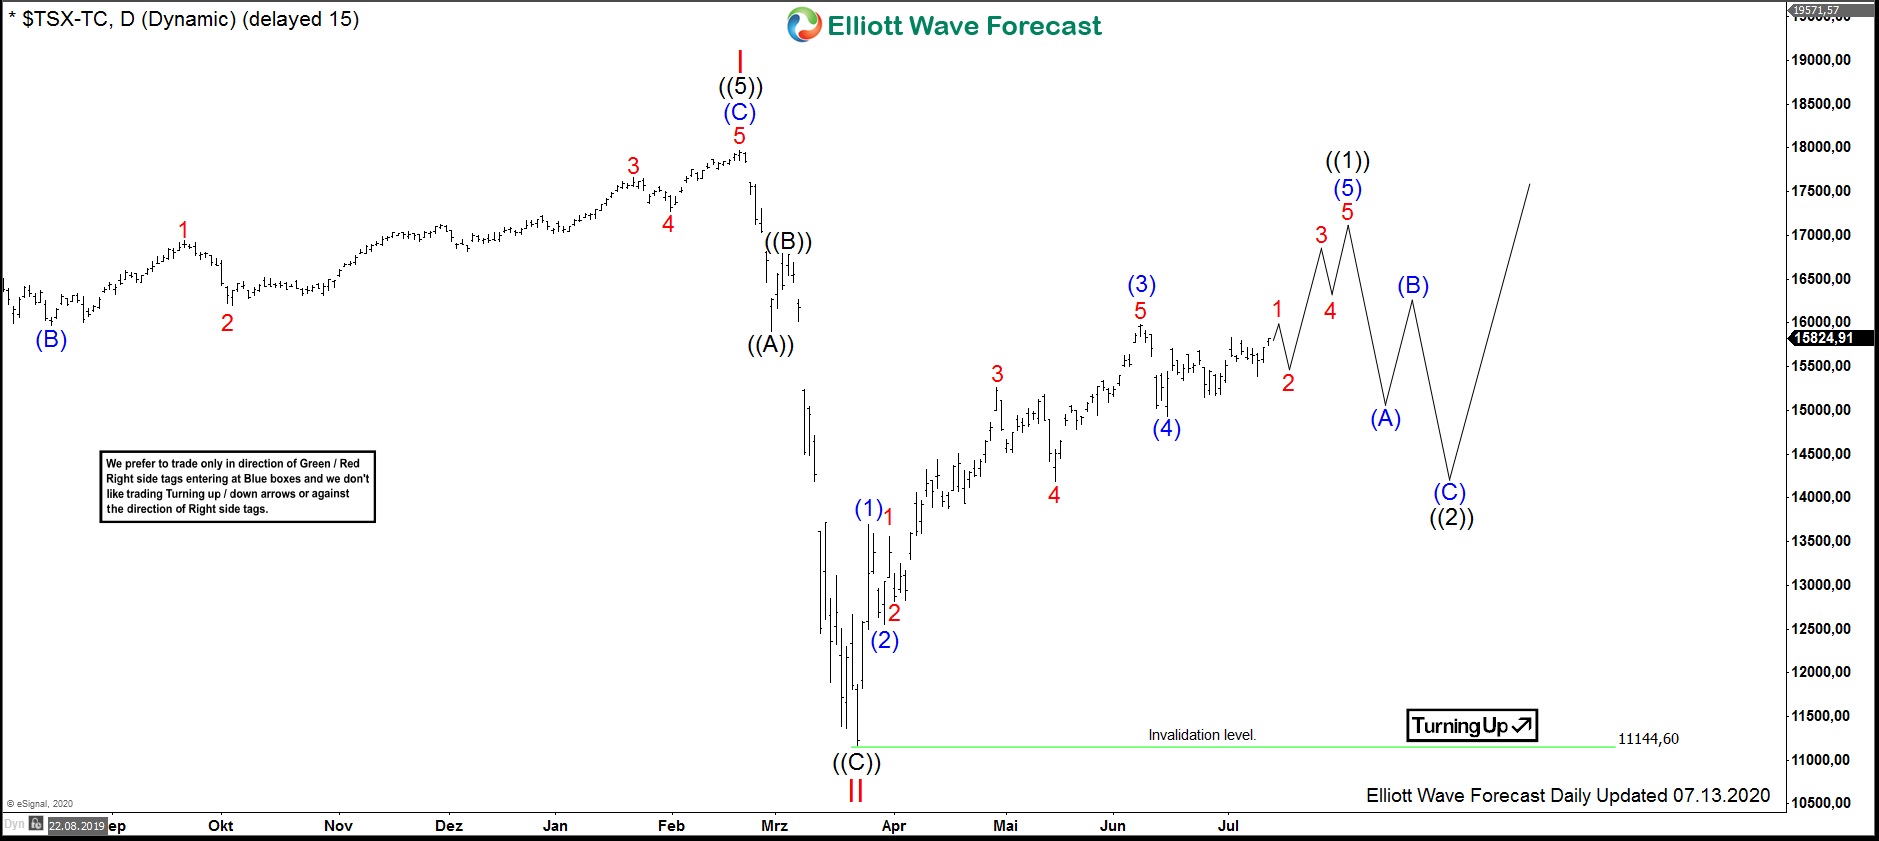
The daily chart below shows in more detail the decline lower in wave II and the following advance in wave ((1)). First, the decline itself is as an Elliott Wave zigzag structure. From March 2020 lows at 11144.6, where daily is turning up, one can count the internal waves (1)-(4) of an impulse in wave ((1)) higher. In short-term cycles, wave (5) of ((1)) may extend higher to end the March 2020 cycle. Hereby, the break of the 15977.1 level would confirm that the wave (5) is already in progress. Once wave ((1)) is over, a correction lower in wave ((2)) should find support in 3, 7, 11 swings above the March lows at 11144.6. Then, expect advance in wave ((3)) of III towards 17970.5 and higher or a push in another leg higher at least.
If commodities are going to rally, then TSX might outperform US American indices providing a good investment possibility for the long and medium-term. As an outlook, TSX may rally to the weekly equal legs towards the 22052-31093 area.
(Click on image to enlarge)


Comments
Log in or sign up to join the conversation.