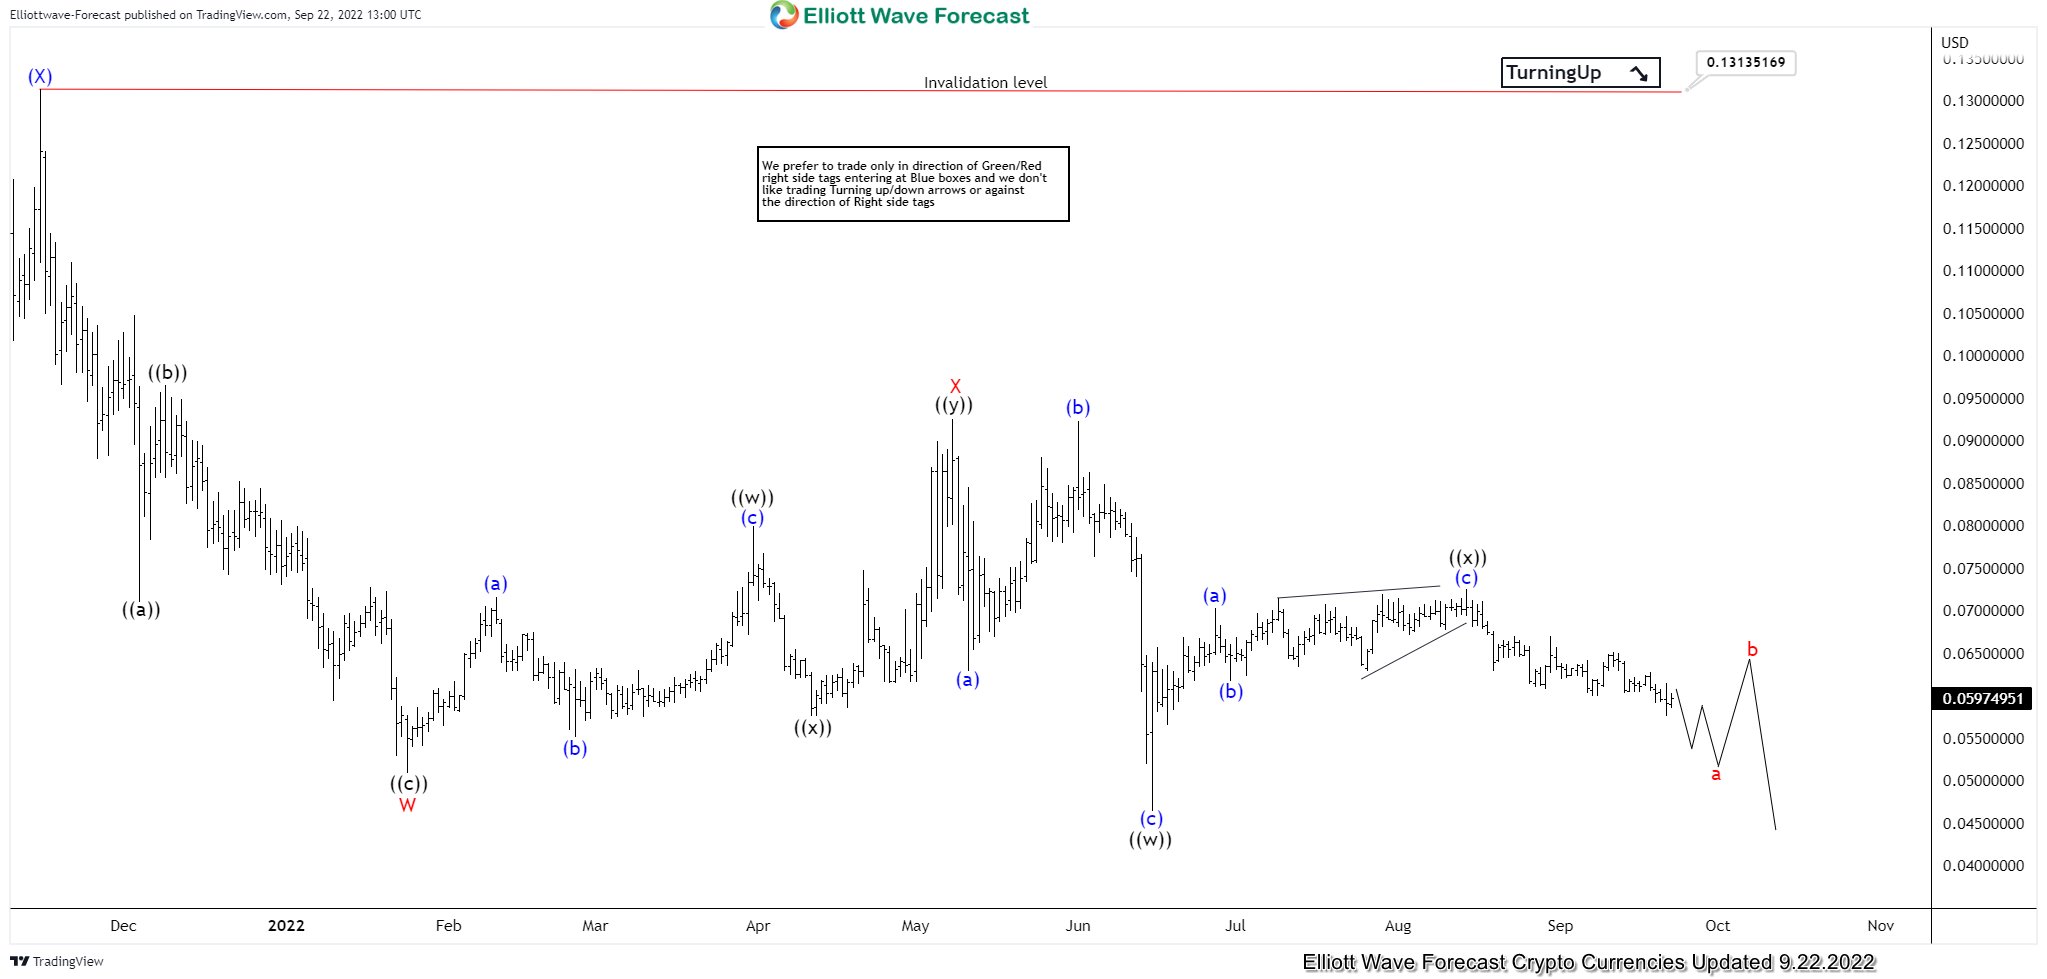
The near-term view is suggesting that the bigger correction against the all-time low unfolded as a double three structure where wave w ended at $0.0103 low, wave x bounce ended at $0.0453 high.
The near-term view is suggesting that the bigger correction against the all-time low unfolded as a double three structure where wave w ended at $0.0103 low, wave x bounce ended at $0.0453 high. While wave y ended at $0.0065 low and with that the correction against all-time lows ended in wave (II) pullback. Up from there, rally higher took place as 5 waves impulse structure where cycle degree wave I ended at $0.1844 high and now doing a pullback to correct the cycle from March 2020 lows within wave II. The internals of that pullback as Elliott wave double three structure where wave ((W)) ended at $0.04456 low. Wave ((X)) ended at $0.1313 high and wave ((Y)) is expected to reach $0.03166- $0.01276 area lower approximately before upside resumes. Near-term, as far as bounces fail below $0.1313 high more downside is expected to take place.
Futures, options, and over the counter foreign exchange products may involve substantial risk and may not be suitable for all investors. Leverage can work against you as well as for you. You should therefore carefully consider your investment experience as well as financial condition before deciding if trading is suitable for you.
Disclaimer:This and other personal blog posts are not reviewed, monitored or endorsed by
TalkMarkets. The content is solely the view of the author and TalkMarkets is not
responsible for the content of this post in any way. Our curated content which is
handpicked by our editorial team may be viewed here.





Comments
Log in or sign up to join the conversation.