

Poverty, using official measures or including non-cash transfers, rises in Wisconsin (while the official measure declines in the US).
The invaluable Wisconsin Poverty Report, coauthored by Tim Smeeding, Julia Isaacs and Katherine Thornton under the auspices of the Institute for Research on Poverty, has just been released.
The key methodological innovation in the report is to calculate a non-cash benefits inclusive measure of poverty. Time series for the market income, official, and augmented measures is displayed in Figure 1.
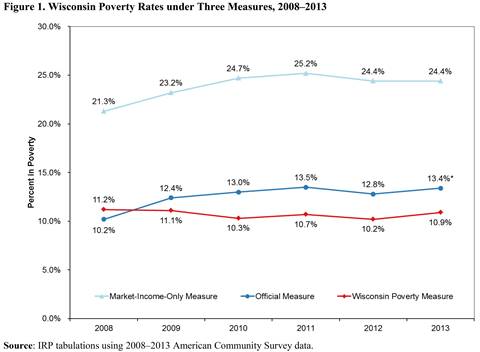
The * indicates that the change is statistically significant for the official series. While poverty rates by both the official and augmented measures both rise in 2013, the official series for the entire United States declined, from 15% to 14.5%.
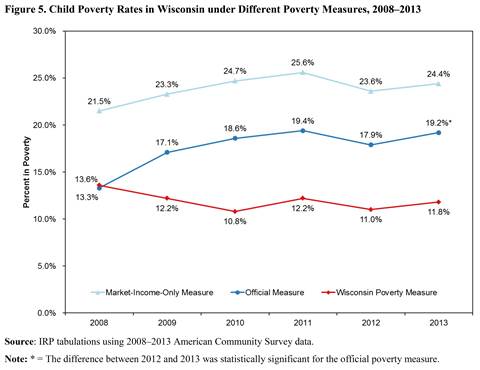
Figure 5 shows official and augmented measures for children.
Finally, I find it of interest that there are Econbrowser readers who constantly decry the trend in supplemental nutritional assistance program expenditures.
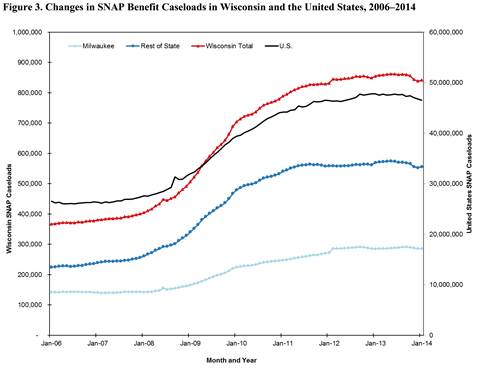
Expenditures are being reduced, but in part because of termination of extended funding for SNAP. If Figures 1 and 5 convey any message, it is that there remains a need for SNAP (well, only if one cares about poverty).
The link to child poverty? From the report (pp. 8-9):
Children got some boost from the recovering economy in 2012, but that boost appears to have dissipated in 2013.While families with children continued to benefit from some of the program expansions under the American Recovery and Reinvestment Act of 2009 (ARRA), it was not enough to protect them against the rising market-income poverty of their parents in 2013.
In contrast, at the start of the recession, the WPM shows different trends from those shown by the two cash-based measures. Between 2009 and 2010, earnings fell sharply, but SNAP benefits rose as more families qualified for assistance and as both SNAP and the federal EITC and other refundable tax benefits were expanded under the ARRA. (Because the state EITC is tied to a percentage of the federal EITC, the state EITC also increased; however, the growth in the state EITC was offset by state action to reduce the state EITC, effective in tax year 2011 and continuing.) As these programs expanded, child poverty as measured under the WPM actually declined, despite the worsening economy and increase in market-income poverty (see Figure 5). Child poverty in 2010 was still higher than poverty for other age groups, but it was low relative to other years.



Comments
Log in or sign up to join the conversation.