


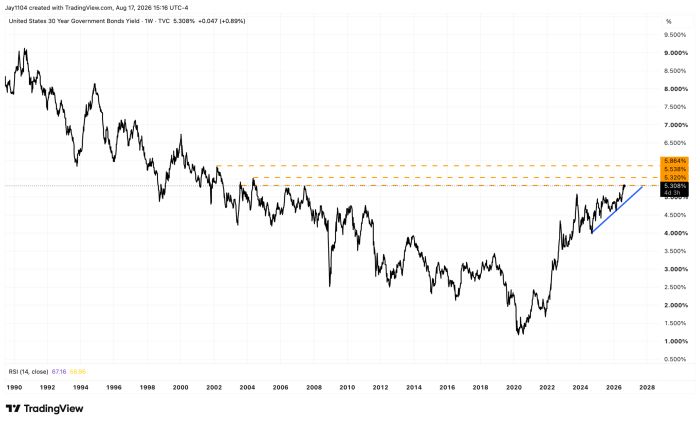
The S&P 500 finished the day down about 50 bps, while 30-year rates continued to climb, reaching 5.31%. From this point forward, assuming it holds, the 30-year could be heading significantly higher. Although it probably doesn’t go in a straight line, a move up to 5.5%-5.8% seems possible.
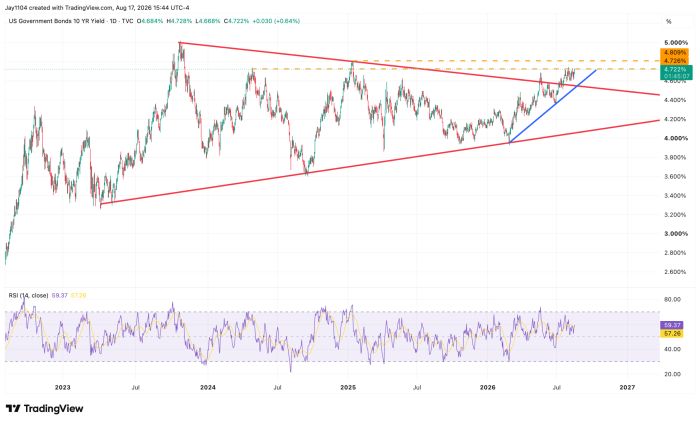
The 10-year rate also rose on the day and is now consolidating right at resistance near 4.72%. One can imagine that a breakout at these levels could lead to a move higher toward 4.80%, with 5% not that far off.
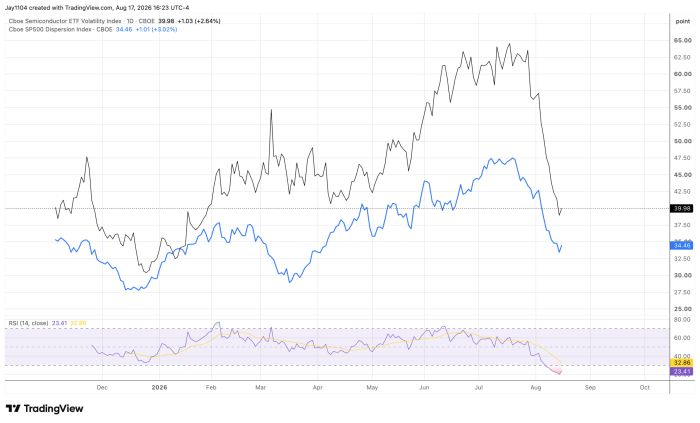
The dispersion index was up a bit today, but I’m guessing that was because the semiconductor sector was a bit stronger, and so was implied volatility for the VXSMH. The semiconductor sector still seems to have a significant influence on the market, but that influence appears to be waning. The only big events on the calendar are Nvidia’s (NVDA) results in a few weeks, followed by Broadcom (AVGO). This could lead to implied volatility in the space rising somewhat heading into those results.
However, credit default swaps may offer a different view of Nvidia, with spreads closing in on the highs seen on July 29. Don’t tell that to the equity investors, though, because Nvidia’s stock price is trading up right along with the widening credit spreads.
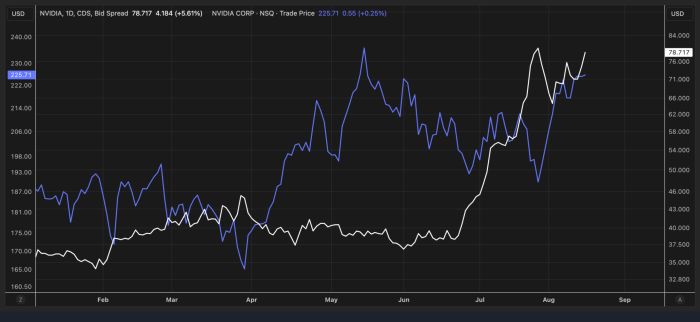
(LSEG)
Broadcom’s CDS actually widened beyond its July 29 levels, but the stock is at least trading lower, as you’d expect. Although you’d expect it to be lower than it is.
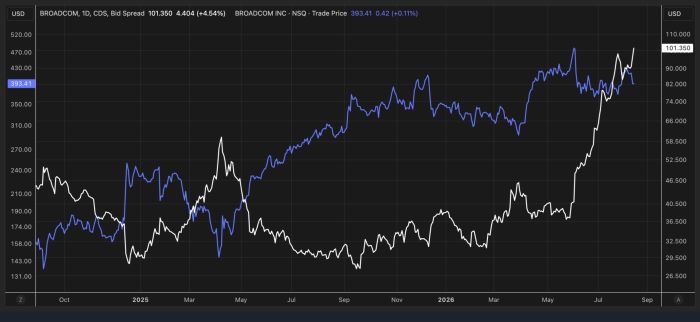
(LSEG)



Comments
Log in or sign up to join the conversation.