


Image Source: Pexels
Today I will begin with my monthly and weekly forecasts of the currency pairs worth watching. The first part of my forecast is based upon 20 years' worth of research of Forex prices, which shows that the following methodologies have all produced profitable results:
- Trading the two currencies that are trending the most strongly over the past six months.
- Trading against very strong weekly counter-trend movements by currency pairs made during the previous week.
- Carry Trade: Buying currencies with high interest rates and selling currencies with low interest rates.
Let's look at the relevant data of currency price changes and interest rates to date, which we compiled using a trade-weighted index of the major global currencies.
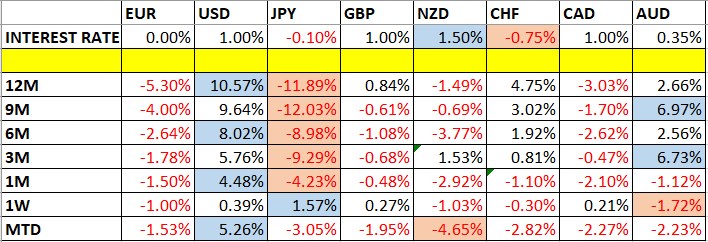
Monthly Forecast for May 2022
For the month of May, I forecasted that the US Dollar Index would rise in value. So far, it has risen by 0.79% this month to date.
Weekly Forecast for May 15, 2022
Last week, I made no weekly forecast, as there were no unusually strong counter-trend price movements in the Forex market over the previous week. I once again make no forecast this week.
The Forex market saw its level of directional volatility rise slightly last week, with 51% of all the important currency pairs or crosses moving by more than 1% in value. Directional volatility is likely to remain the same over the coming week.
Last week was dominated by relative strength in the Japanese yen and relative weakness in the Australian dollar, the New Zealand dollar, and the euro.
Key Support/Resistance Levels for Popular Pairs
I teach that trades should be entered and exited at or very close to key support and resistance levels. There are certain key support and resistance levels that can be watched on the more popular currency pairs this week.
|
Currency Pair |
Key Support / Resistance Levels |
|
AUD/USD |
Support: 0.6904, 0.6866, 0.6774, 0.6683 Resistance: 0.7059, 0.7125, 0.7180, 0.7227 |
|
EUR/USD |
Support: 1.0444, 1.0427, 1.0372, 1.0350 Resistance: 1.0425, 1.0444, 1.0591, 1.0604 |
|
GBP/USD |
Support: 1.2226, 1.2139, 1.1976, 1.1900 Resistance: 1.2277, 1.2406, 1.2500, 1.2624 |
|
USD/JPY |
Support: 130.01, 129.83, 129.55, 128.59 Resistance: 129.45, 130.01, 131.50, 132.00 |
|
AUD/JPY |
Support: 89.09, 88.37, 86.55, 86.19 Resistance: 89.93, 90.32, 90.52, 91.99 |
|
EUR/JPY |
Support: 134.35, 133.66, 132.35, 131.91 Resistance: 136.83, 138.26, 140.00, 140.67 |
|
USD/CAD |
Support: 1.2869, 1.2794, 1.2778, 1.2684 Resistance: 1.2953, 1.2995, 1.3020, 1.3127 |
|
USD/CHF |
Support: 0.9975, 0.9833, 0.9791, 0.9753 Resistance: 1.0050, 1.0111, 1.0139, 1.0211 |
Let us see how trading reversals from two of last week’s key levels could have worked out:
EUR/USD
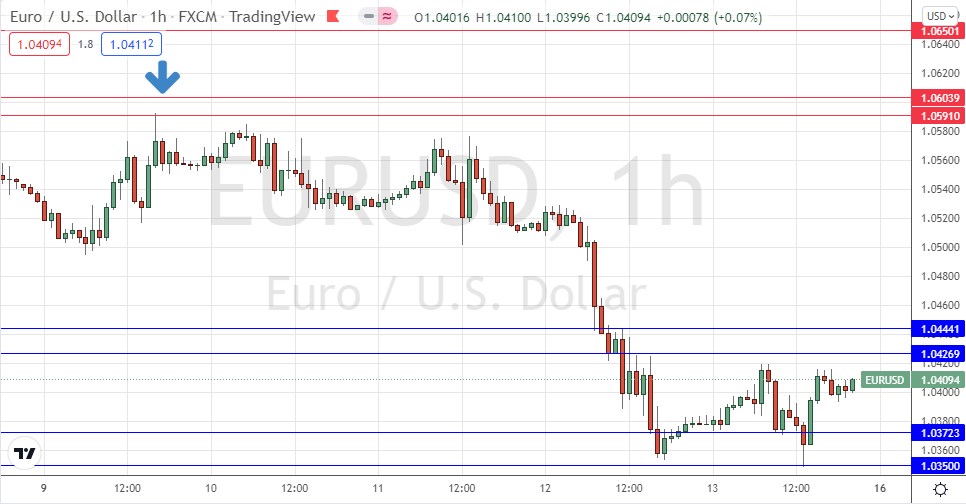
I had expected the level at $1.0591 might function as resistance, as it had previously acted as both support and resistance. Note how such “flipping” levels can be very reliable reversal points.
The H1 chart below shows how the price rejected this level with bearish price action, which included a near inside bar during the New York session last Monday. The entry point is marked by the down arrow. This trade has been profitable, achieving a maximum positive risk/reward ratio just shy of 5 to 1 based upon the size of the entry candlestick structure.
GBP/USD
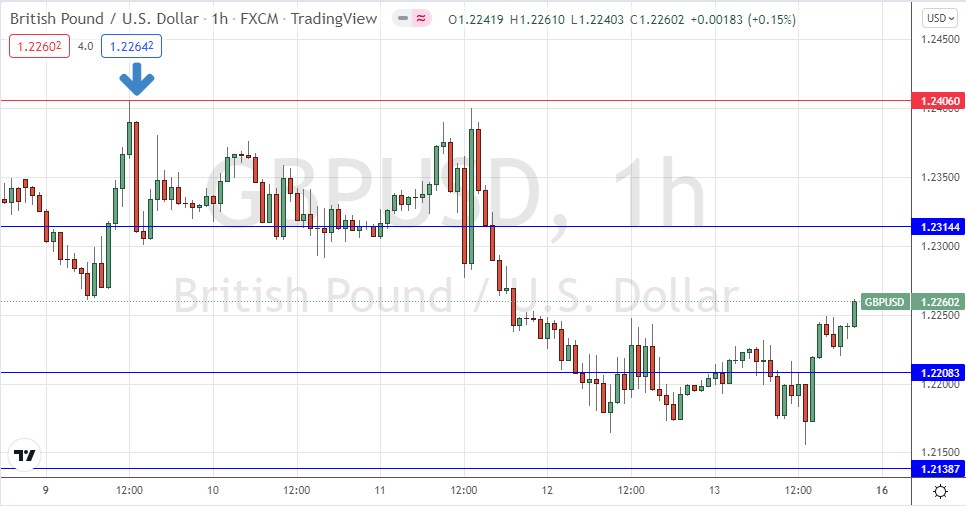
I had expected the level at $1.2406 might function as resistance, as it had also previously acted as both support and resistance. The H1 chart below shows how the price rejected this level with a large engulfing candlestick during Monday’s London/New York overlap session, which is often a great time of day to be trading Forex.
The entry point is marked by the down arrow. This trade has not been very profitable, achieving a maximum positive risk/reward ratio of only 1.5 to 1 because the entry candlestick structure was so large (it had a range of approximately 100 pips). This is a good lesson as to how very large signal candlesticks should be treated with caution and can often best be traded by dropping down to a shorter time frame.
Comments
Log in or sign up to join the conversation.