
Here are graphs of employment, industrial production, personal income ex.-transfers, manufacturing and trade sales, and real GDP (five indicators that the NBER Business Cycle Dating Committee has focused on in the past) depicting the state of the macro-economy, given what we know today, and compared to eight years ago.
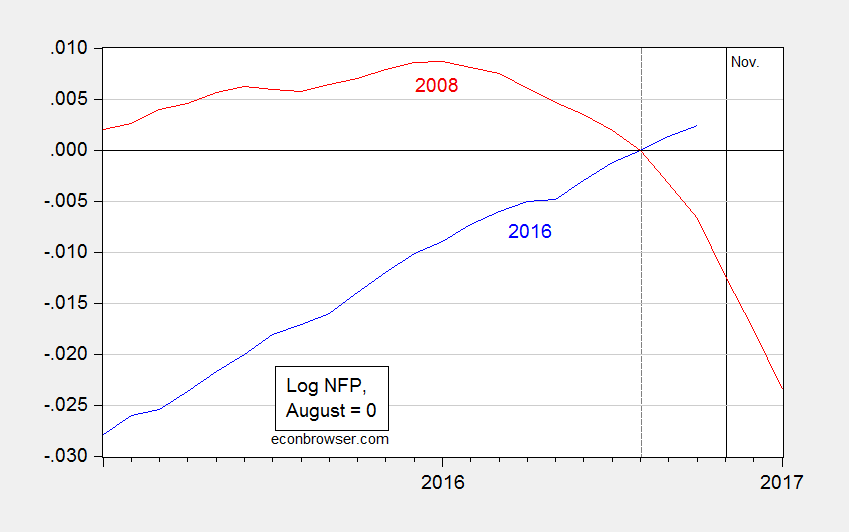
Figure 1: Log nonfarm payroll employment current (blue), and eight years ago (red), both normalized to August. Source: BLS via FRED, and author’s calculations.
Nonfarm payroll (NFP) employment growth from trough (2007M12) to current (2016M10) is 10.1%; prior trough to peak (2001M11 to 2007M12) was 5.3%. NFP employment growth from peak (2007M12) to current (2016M10) is 4.6%; prior peak to peak (2001M03 to 2007M12) is 4.2% (all calculations in log terms).
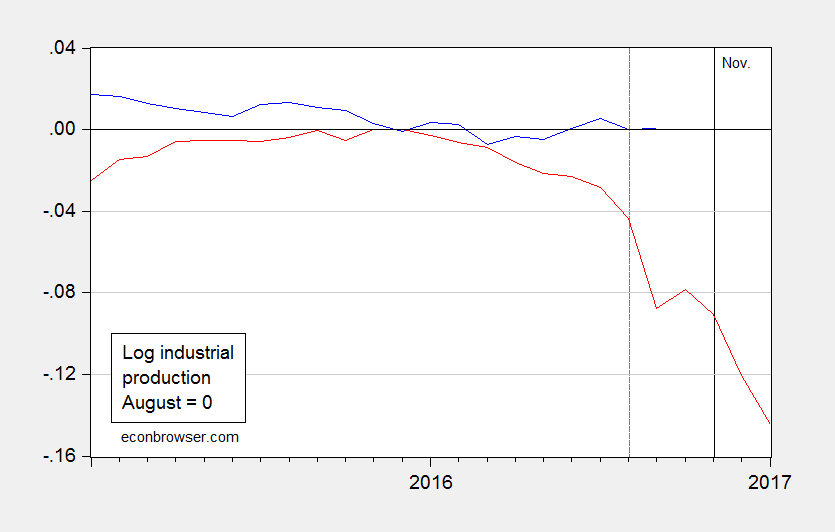
Figure 2: Log industrial production current (blue), and eight years ago (red), both normalized to August. Source: Federal Reserve Board via FRED, and author’s calculations.
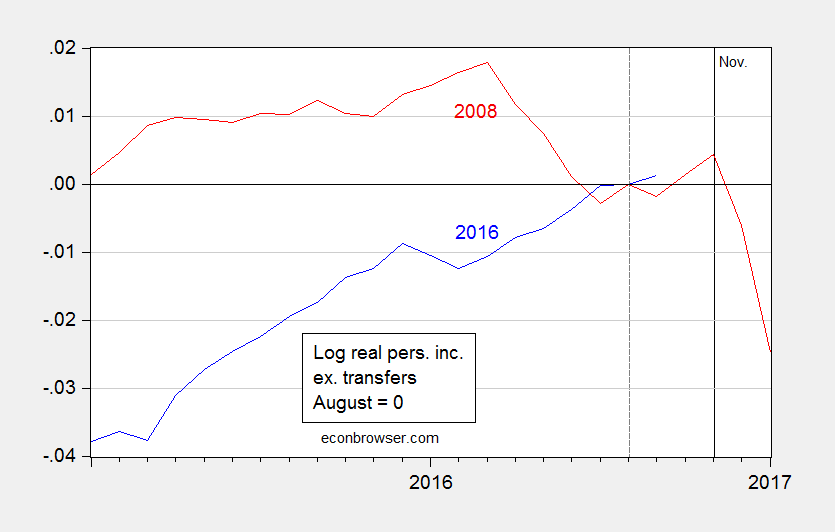
Figure 3: Log personal income excluding transfers, in Ch.2009$ current (blue), and eight years ago (red), both normalized to August. Source: BEA via FRED, and author’s calculations.
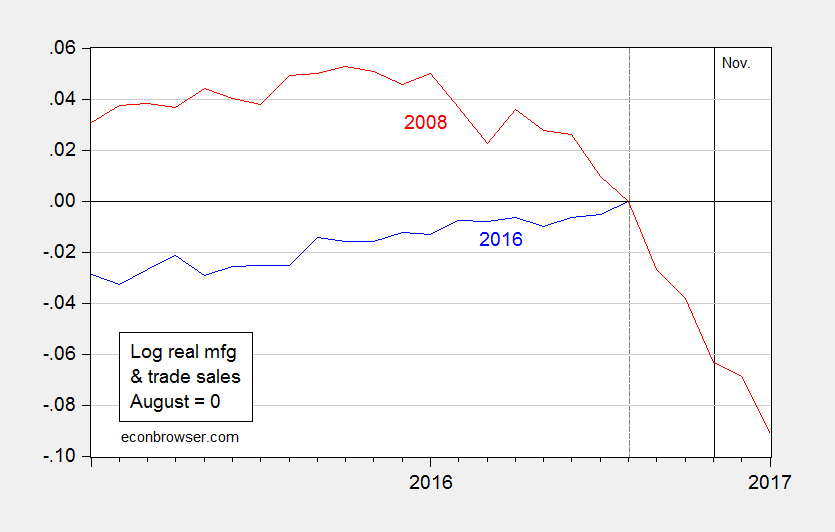
Figure 4: Log manufacturing and trade sales, in Ch.2009$ current (blue), and eight years ago (red), both normalized to August. Source: BEA via FRED, and author’s calculations.
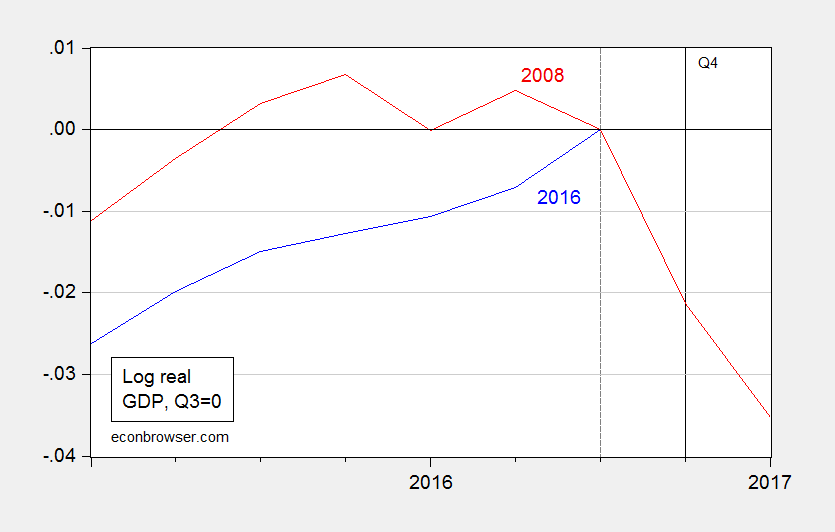
Figure 5: Log GDP, in Ch.2009$ current (blue), and eight years ago (red), both normalized to Q3. Source: BEA (2016Q3 advance release), and author’s calculations.


Comments
Log in or sign up to join the conversation.