


TLN is nearing the completion of its bearish cycle from the September 2025 high. Additionally, the stock is finalizing a familiar pattern that suggests a significant bullish setup for long-term investors.
Talen Energy (Nasdaq: TLN) is a leading independent power producer in the United States, operating a diversified portfolio of nuclear, natural gas, coal, and oil-fired generation assets. The company supplies electricity, capacity, and ancillary services to wholesale power markets while expanding its role in powering AI-driven digital infrastructure, making it a key player in the evolving U.S. energy sector.
A profitable investing strategy in the stock market is to buy low and sell high. It's like an unwritten rule. However, despite this popular guide to investing, a lot of investors and traders still get it wrong. From the Elliott wave perspective and especially the way we use it, we like to buy from the blue boxes in a bullish trend. Contrast, when in a bearish market, we like to sell bounces from the blue box as well. This is how our members have been able to make and keep profits for over 20 years. Meanwhile, another blue box setup appears to have emerged on TLN for the long-term positional investors.
TLN Long term Elliott Wave Analysis - The Background (17th August 2026 Update)
Following its secondary market launch in May 2023 at approximately $46, Talen Energy rallied over 800% in just 29 months. Applying Elliott Wave theory, this price action reflects a textbook impulse structure. The initial bullish cycle began with Wave I, which climbed to $57.30 by August 2023, followed by a corrective Wave II pullback that found support at $50.75 in October 2023.
Following the breakout from the October 2023 low, the stock price rallied significantly from $50.75 to reach $258, completing wave III in January 2025. Subsequently, a wave IV pullback pressured the price down to $158 by March 2025. Wave V of (I) then commenced, driving the stock to an all-time high of $451 in September 2025.
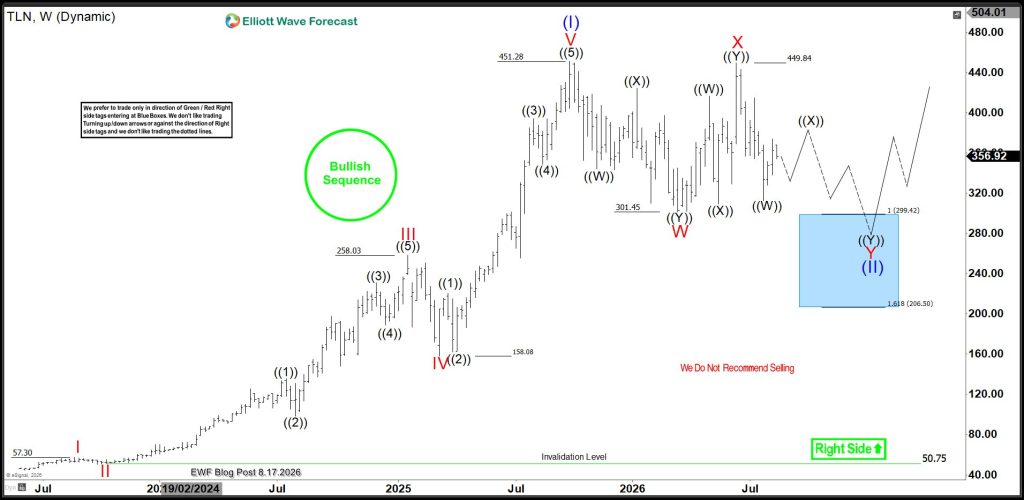
According to Elliott Wave theory, a 5-wave impulsive cycle is typically followed by a 3-wave corrective cycle. In this instance, the initial bullish phase has concluded as wave (I), while the current pullback from the September 2025 high represents the development of a corrective wave (II). Since third waves are historically stronger than first waves, the completion of wave (II) sets the stage for a significant rally, with wave (III) potentially targeting $950 or higher.
On August 17, 2026, we presented a chart illustrating the ongoing development of the wave (II) pullback. At that time, the stock had completed wave ((W)) of Y of (II) and was nearing the conclusion of wave ((X)). We projected that a subsequent 3-swing decline would follow, guiding the price into the 299.42–206.50 blue box zone, where we advised readers to initiate long positions.
TLN Weekly Elliott Wave Analysis - 21 September 2026 Update
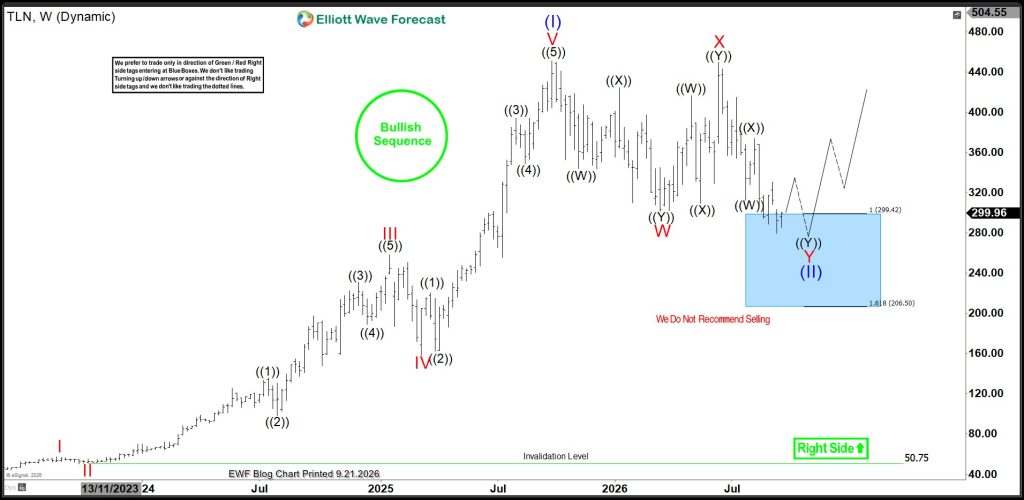
The latest weekly chart confirms that TLN is currently trading within the blue box zone. The corrective wave (II) may have already concluded, or it could see one final dip deeper into the zone before exhaustion. The critical focus for traders and investors is this blue box, as a potential move toward an impulsive wave (III) could trigger a rapid acceleration. If this cycle is confirmed, it would represent the strongest surge since the stock's inception, signaling a long-term period of dominance for the bulls over the next decade.



Comments
Log in or sign up to join the conversation.