


Ford (F) reported a 6.6% decline in third-quarter U.S. vehicle sales to 509,764 units, partly reflecting the planned discontinuation of the Escape and Lincoln Corsair. Nevertheless, adjusted retail market share improved, and demand for larger SUVs and commercial trucks remained encouraging. Production disruptions involving the F-150 supply chain also created pressure on quarterly wholesale shipments. These challenges, combined with tariffs and higher vehicle ownership costs, could weigh on near-term earnings expectations.
Elliott Wave Outlook: Ford (F) Weekly Chart July 2026
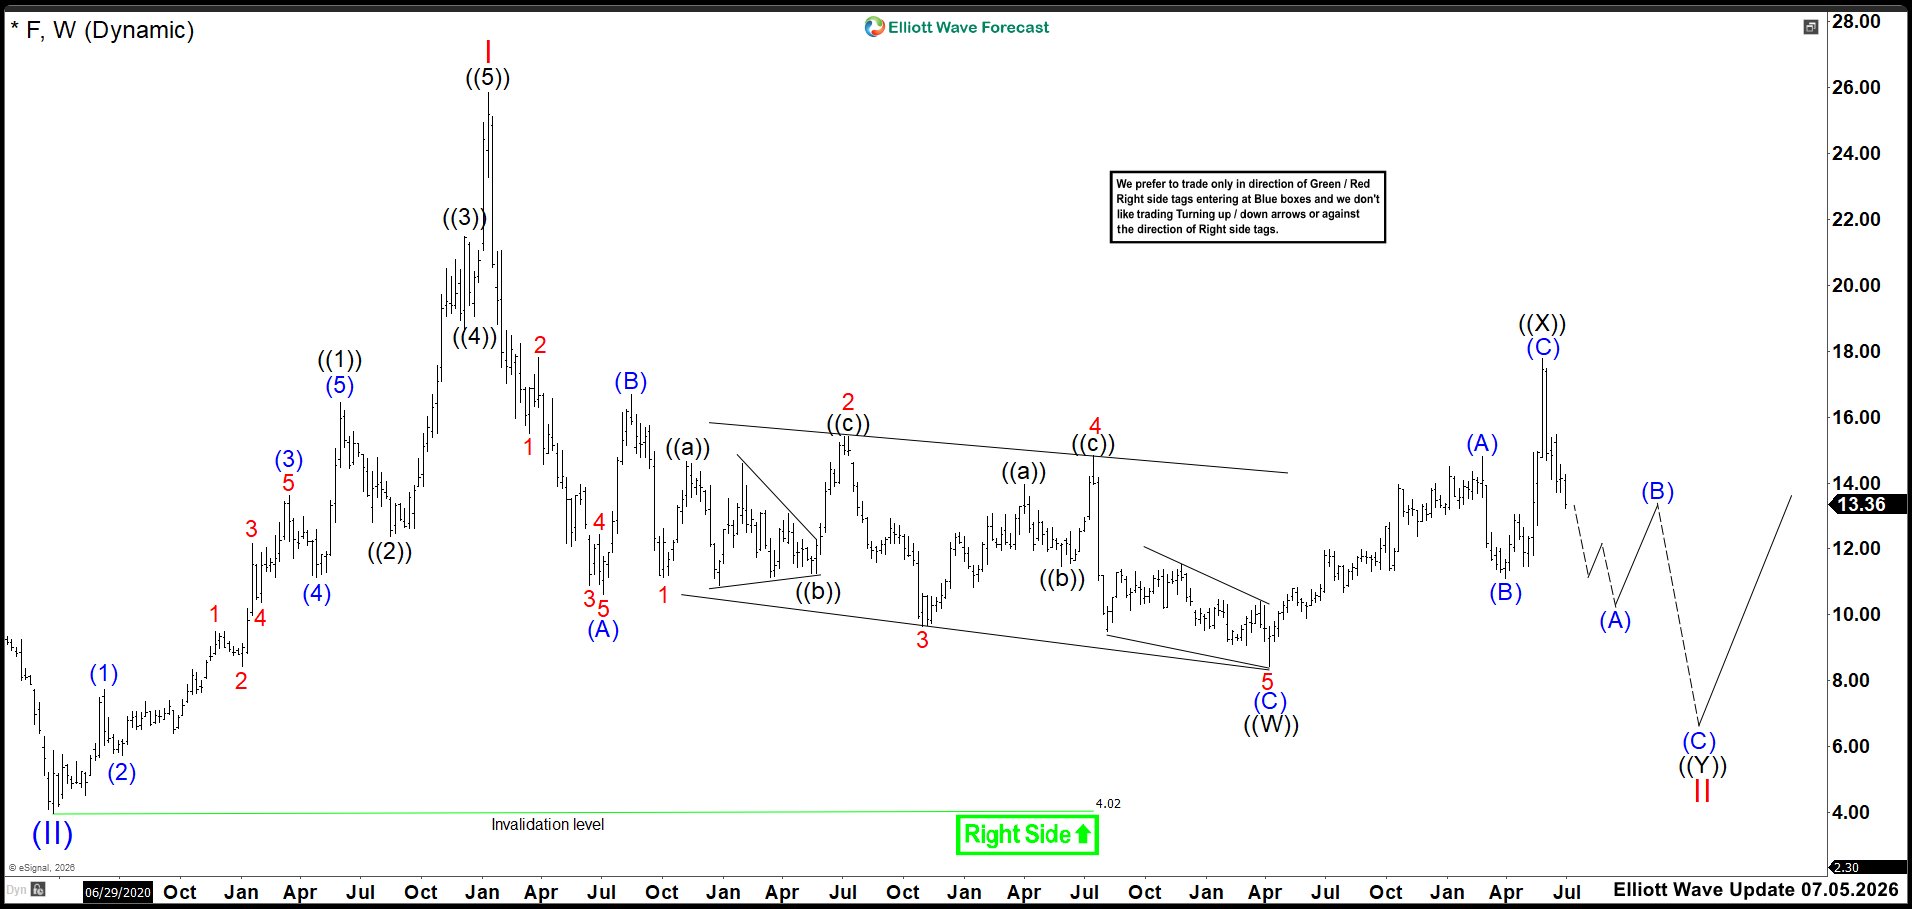
Back in July, Ford (F) broke above wave (B), initially suggesting a potential bottom. However, we identified only three waves higher and maintained our bearish outlook. We emphasized that a sustained trend reversal required an impulse or leading diagonal from the lows.
Therefore, we viewed the rebound as wave ((X)) and expected wave ((Y)) of II to develop. Our bearish scenario called for another three-wave decline below 8.43 before completing the corrective structure.
(If you want to learn more about Elliott Wave Principle, please follow these links: Elliott Wave Education and Elliott Wave Theory.)
Elliott Wave Principle Behind the Market Structure
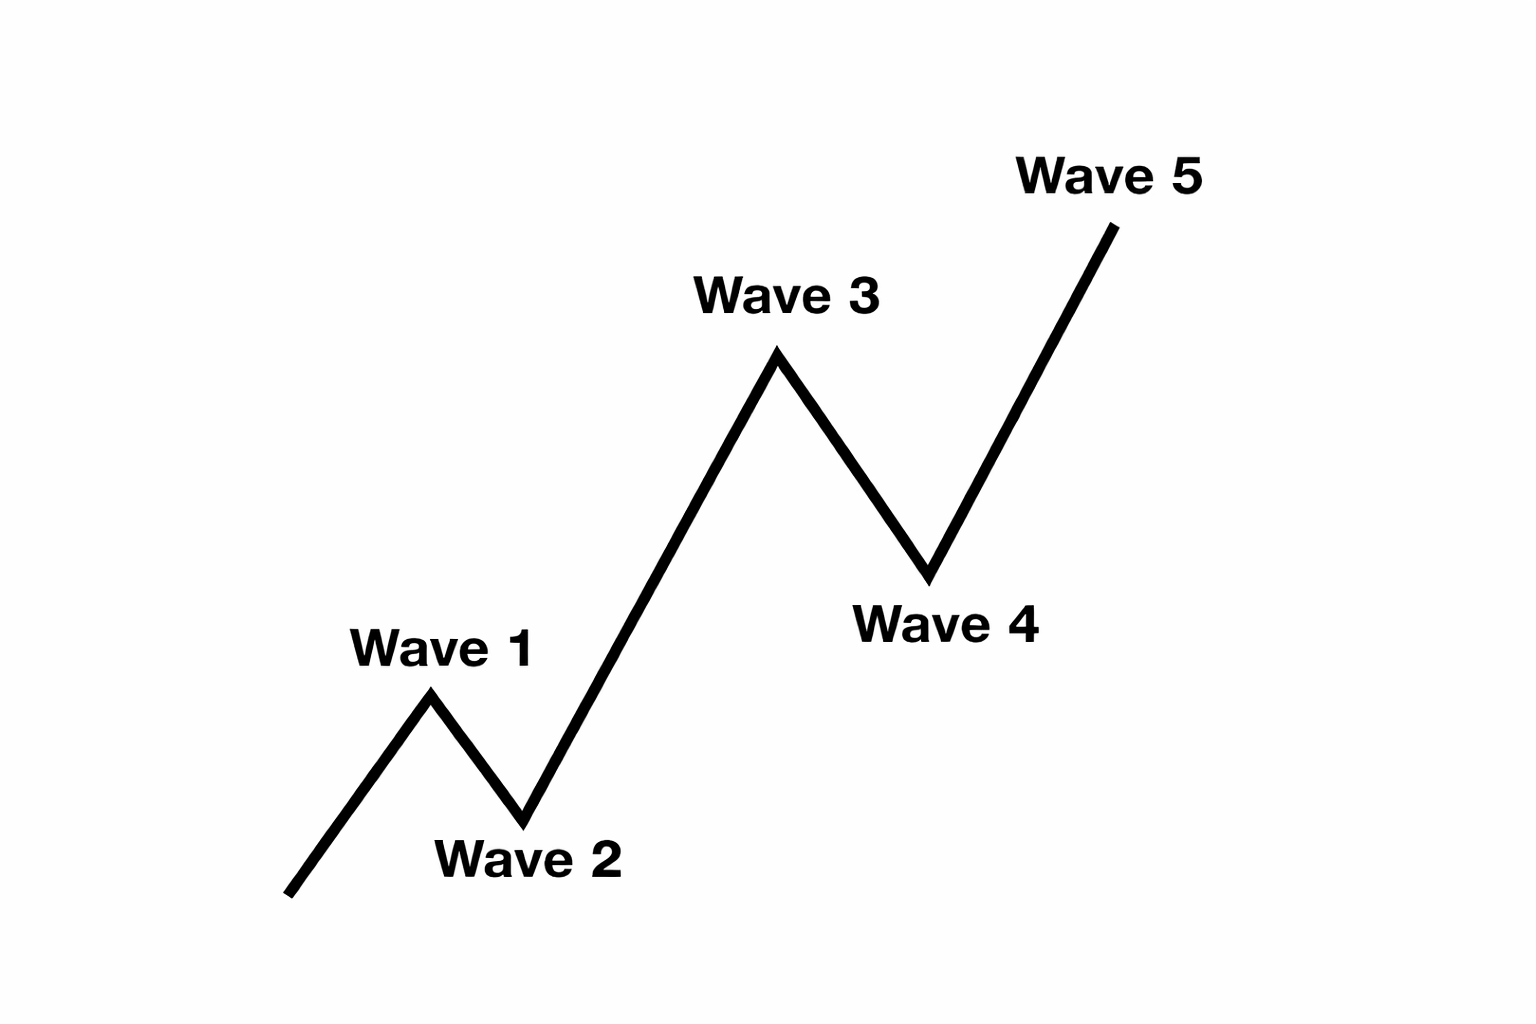
Impulse
An impulse is a clean 5‑wave pattern that drives the trend forward.
Waves 1‑3‑5 are strong and directional.
No overlap between waves 1 and 4.
Wave 3 is usually the strongest.
Structure is clear, with increasing momentum
Elliott Wave Outlook: Ford (F) Weekly Chart October 2026
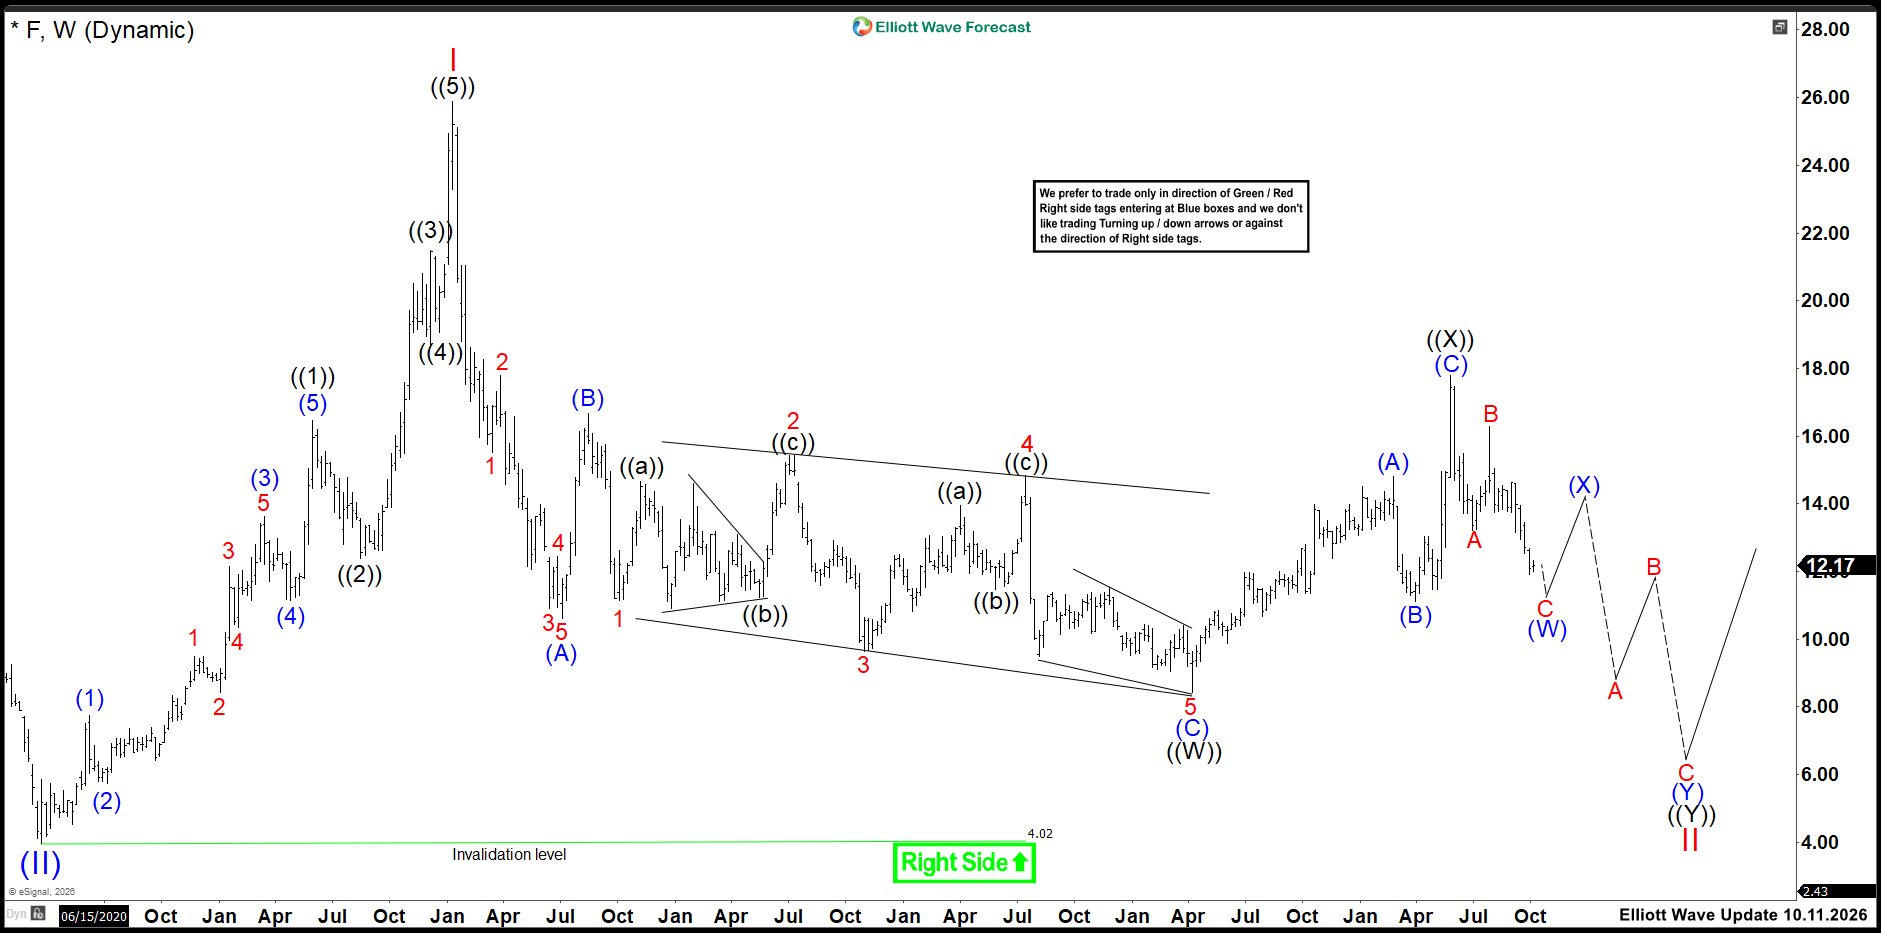
Ford's (F) weekly chart continues to support the bearish corrective scenario we anticipated in July. The rally completed wave ((X)) near 17.80 before sellers regained control. Since then, the market has developed another corrective sequence to the downside. Moreover, the recent rebound formed wave B, followed by renewed selling pressure. This structure suggests Ford is currently developing wave C of (W).
In the near term, we expect Ford to extend lower toward the 10.50–11.00 area to complete wave (W). Afterward, wave (X) could trigger another corrective rebound toward the 14.00 area. However, this recovery should remain temporary within the larger bearish sequence. Subsequently, we expect wave (Y) to resume the decline and break below the previous 8.43 low. The projected structure could eventually push prices toward the 6.00 area, completing wave ((Y)) of II.
Despite the expected decline, the larger bullish structure remains valid above the 4.02 invalidation level. Therefore, we continue to view the current weakness as a corrective phase within the broader bullish cycle. Once wave II completes, Ford could begin a new impulsive advance.



Comments
Log in or sign up to join the conversation.