

Indications are that tomorrow, we will receive a very strong report on GDP growth (Jim will have his recession probabilities assessment soon after the release). (GS at 4.1%, MacroAdv at 5.0%, NY Fed at 2.8%, FRB Atlanta NowGDP at 4.5%.) At the same time, we are seeing a flattening of the yield curve. I urge observers to not take as “hard data” the advance release of any macro data as firm. Here is a cautionary tale.
In early 2001 (April I think), I was a staffer on the (G.W. Bush) CEA. The macroeconomic data we had in our possession at the time suggested no recession. Yet, subsequently, the NBER Business Cycle Dating Committee (BCDC) set the beginning of the recession in March 2001.
The BCDC focused at the time on the monthly GDP series from Macroeconomic Advisers, nonfarm payroll employment, industrial production, real manufacturing and trade sales, and real personal income ex.transfers. All of these were revised from the series we had in April. Instead of showing the evolution of these series, I’ll use as a shorthand GDP revisions.
(Click on image to enlarge)
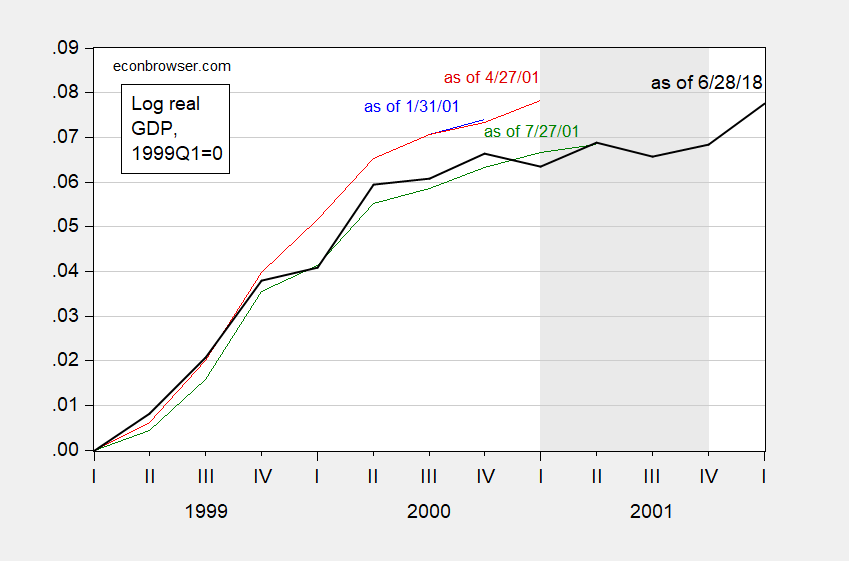
Figure 1: Real GDP normalized to 1999Q1 as of 1/31/2001 (blue), as of 4/27/2001 (red), as of 7/27/2001 (green), as of 6/28/2018 (black). NBER defined recession dates shaded gray. Source: ALFRED, BEA, NBER, and author’s calculations.
Notice that the growth rate does not drop below zero even after the annual benchmark revision reflected in the July release. This is shown in Figure 2 below.
(Click on image to enlarge)

Figure 2: Quarter-on-quarter annualized growth rates of real GDP as of 1/31/2001 (blue), as of 4/27/2001 (red), as of 7/27/2001 (green), as of 6/28/2018 (black). NBER defined recession dates shaded gray. Source: ALFRED, BEA, NBER, and author’s calculations.
For similar cautionary tales regarding the last recession, see here and here (Bonus: Dr. Casey Mulligan figures in both!)



Comments
Log in or sign up to join the conversation.