


Two of our mutual funds, the China Region Fund (USCOX) and Global Resources Fund (PSPFX), offered investors very attractive risk/reward profiles compared to their respective peer groups for the 12-month period ended March 31. I believe this is the result of our unique, actively-managed quant models and nimbleness to act based on market volatility, money flows and other factors.
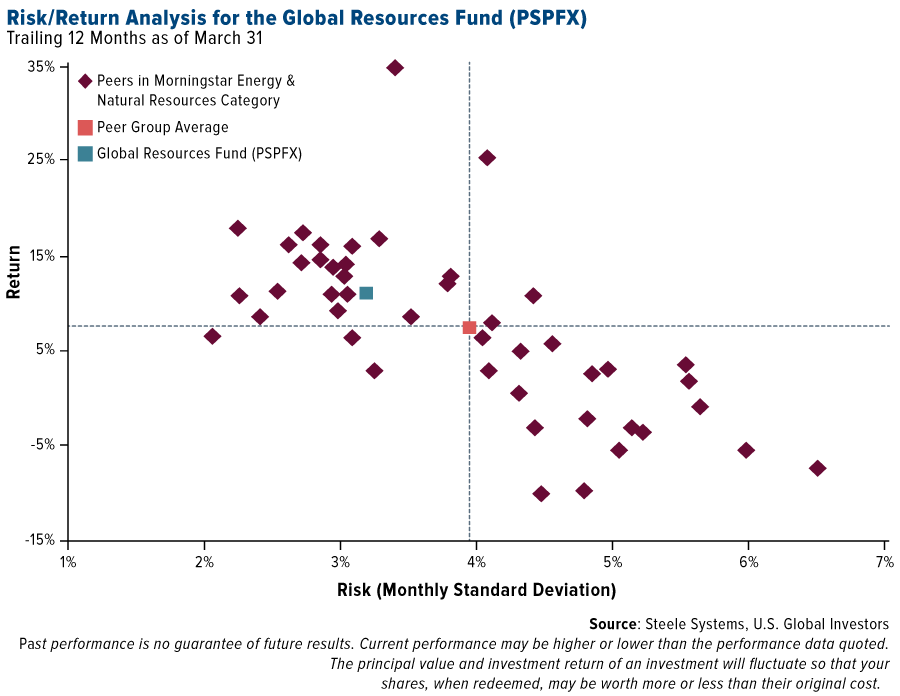
Look at the scatterplot graph below. The y-axis measures the 12-month return, while the x-axis measures monthly standard deviation, or, more generally, risk. Ideally, for any given time period, you want your investment to appear in the upper-left quadrant, as this indicates you’ve received higher returns for a relatively low amount of risk.
For the 12-month period ended March 31, the China Region Fund (USCOX) delivered a noteworthy return of 37.06 percent, compared to its benchmark, the Hang Seng Composite Index, which rose 24.40 percent. Its return was also higher than the average for the China peer group. At the same time, USCOX had relatively lower risk than many of its peers, with a monthly standard deviation of between 3 and 4 percent.

In USCOX we maintain overweight positions in consumer discretionary and technology. As we see it, these sectors are where the growth is, driven by innovative tech firms, from Sunny Optical to Tencent; automakers such as Geely Automotive; and casino names like Galaxy Entertainment and Wynn Macau.
Explore the China Region Fund (USCOX) by clicking here!
A Look at the Global Resources Fund (PSPFX)
Our Global Resources Fund (PSPFX) similarly had an attractive risk/reward profile for the one-year period ended in March. The fund returned 11 percent, well above many of its peers in energy and materials, and it was less risky than the group’s average.
For PSPFX, our rigorous quant research process begins with 1,600 possible names in the energy and materials space. We immediately whittle this number down to around 700 or 800 after screening for net debt-to-enterprise value—we don’t want overly-leveraged companies—as well as liquidity and free cash flow growth.
Next, we look at enterprise value-to-EBITDA—or earnings before interest, taxes, depreciation, and amortization—meaning we seek companies that offer greater value in their sector relative to their peers. In other words, we compare oil producers to oil producers, not oil producers to, say, logging and timber companies.
Finally, we screen for return on invested capital (ROIC), one of the most widely-used factors, and free cash flow yield. We like to invest in companies that we anticipate will reward us.
This gives us the 50 or so names that eventually make it into PSPFX. It’s a process that we’re committed to and that we believe delivers highly competitive results.
Commodities on Sale
Another reason investors might want to consider commodities is that they’ve rarely been this cheap relative to stocks. The equities-to-commodities ratio, as measured by the S&P 500 Index and the S&P GSCI Index, is at its lowest level in nearly 50 years. This means that materials could be ripe for mean reversion, representing one of the most attractive entry points in recent memory.
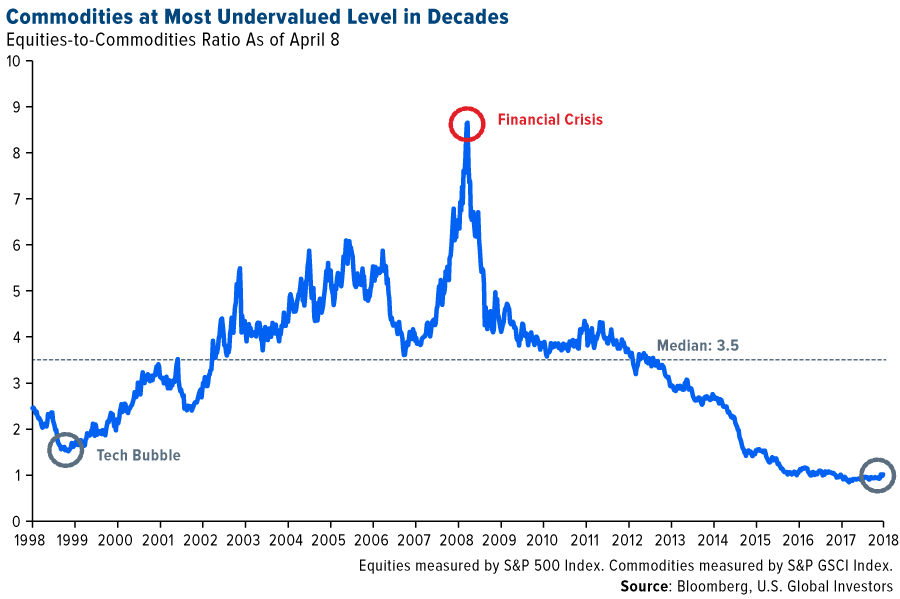
Commodities are also responding to geopolitical jitters. With oil, aluminum and other materials making multiyear highs because of Russian sanctions and military action in Syria, Goldman Sachs recently issued a bullish statement, writing that “the strategic case for owning commodities has rarely been stronger.”
Of course, this is only one investment bank’s opinion, and there’s no guarantee that past events will end up being repeated. It’s possible a full recovery is still months or even years away. Proceed with caution, but I think it’s worth your time to at least consider adding to your commodities exposure.
Interested in gaining exposure to commodities and raw materials? Visit the Global Resources Fund (PSPFX) page!

Comments
Log in or sign up to join the conversation.