


Image Source: Pexels
My cell phone has been taunting me. It keeps sending me Delta flight notifications.
I was originally scheduled to fly to Milan, Italy, today to watch Olympic Hockey all week. But I changed my plans (because it’s Valentine’s Day and my daughter is eight years old), and I elected to go to the World Baseball Classic finals in March instead.
I’m having a little bit of remorse. I’m a huge fan of the Winter Olympics, whether it's half-pipe, hockey, skating, or cross-country. Last night was brutal for U.S. men’s skater Ilia Malinin. But I enjoyed the lead-up and moment when Kazakhstan’s Mikhail Shaidorov won the men’s gold medal for skating instead.
At the onset of his program, NBC commentator Tara Lipinski said Shaidorov was just planting the seeds for future success, all but writing him off while suggesting he might be in the mix to win a medal in 2030. The expectation went that Malinin would win easily, followed by his rival in Japan.
But then, seconds later, Shaidorov’s music changed, and it was the song from the Diva Dance in the Fifth Element. He went off from there. I had to root for him solely on the basis of his song selection, but his performance was also flawless. Then we saw many people fall after him, including Malinin. And in Olympic spirit, anything did happen. Congratulations to Shaidorov on that title, and be sure to watch it.
Meanwhile, that flight I mentioned is supposed to leave in three hours. I’ll spend Valentine’s Day with my wife and daughter instead. It's a fair trade off. Now, let’s talk about the markets.
With Momentum Negative
For the last two weeks, we’ve been juggling some very choppy momentum conditions. Momentum conditions peaked on Jan. 12 and experienced a significant rise in selling pressure, which carried us into the end of the month.
You may recall, I threw my hands up and dumped silver and gold ETFs on Jan. 26. Our S&P 500 Capital Wave reading went negative on Jan. 28. Since then, we’ve had a collapse in gold and silver prices, a blowout in the cryptocurrency world, and one of the worst momentum selloffs in over a decade (two Thursdays ago).
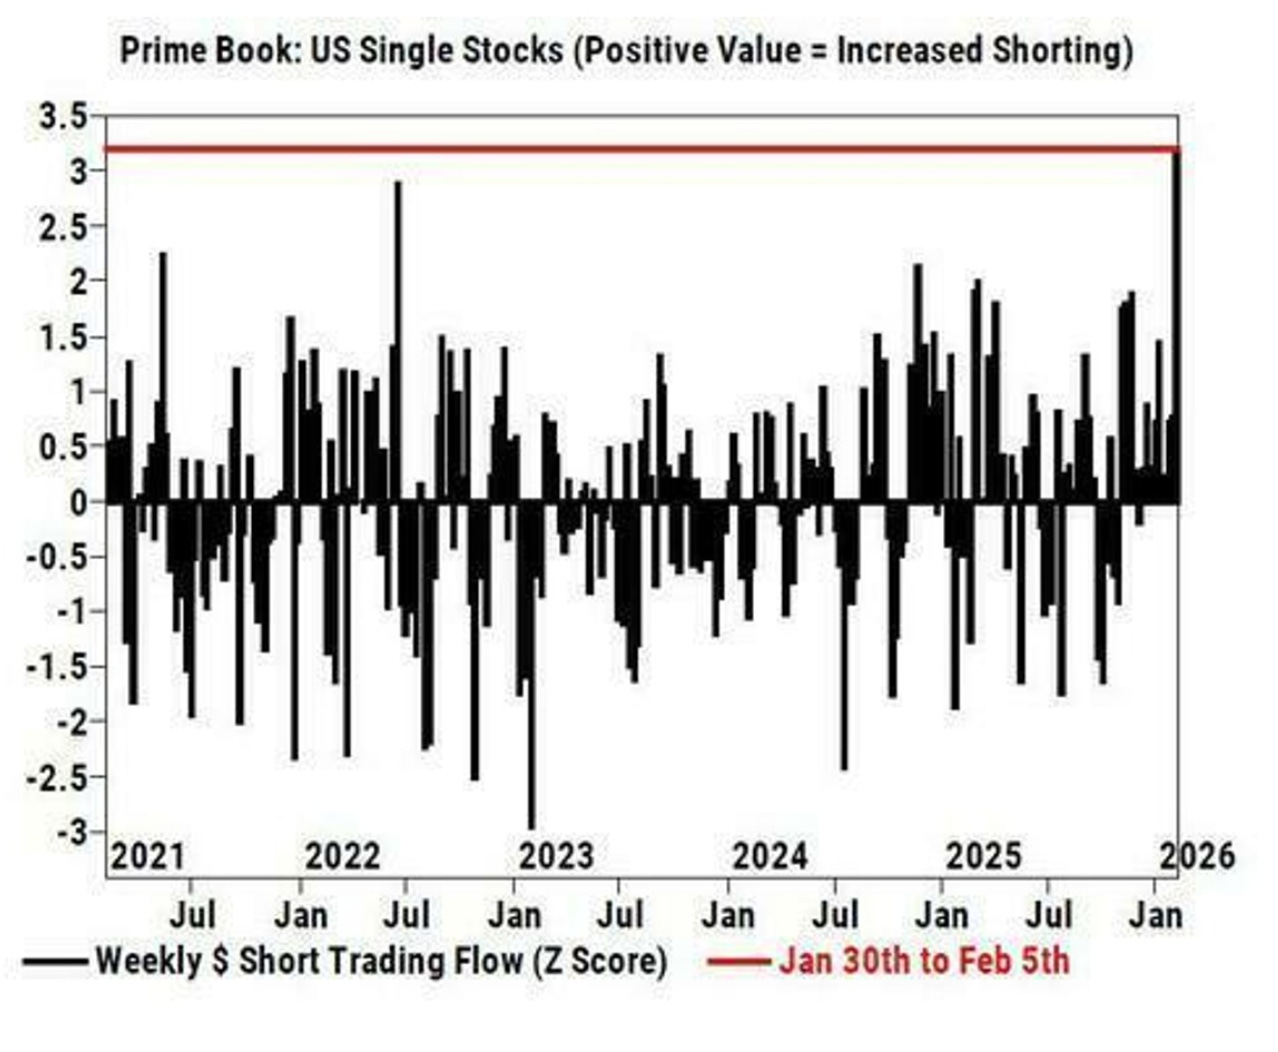
Selling pressure has increased, aided by this chart.
(Click on image to enlarge)
Image Source: ZeroHedge and Bloomberg
That first week of the month was ferocious on the short-selling side. For those who don’t know, short selling is not about buying put options on stocks and hoping they rise as stock prices drop.
Short selling is the process of borrowing shares from someone, selling them into the market, hoping they will go down, and then buying them back at a lower price. Then, traders make money by pocketing the difference between the selling price (first step) and the repurchasing price (second step).
There are a few key factors fueling this frenzy. First, we are on the backside of a cycle where we tend to see higher Beta tech names give way to consumer defensives and materials/energy. More importantly, this “AI Apocalypse” trade seems to be catching more fire.
You may recall the “Retail Apocalypse” trade from the last decade. The basic argument was that companies like Kohl’s, Toys R Us, Sears, Caldor, etc. would all go the way of the dinosaur because of Amazon, e-commerce, and huge slumps in retail traffic. A lot of names disappeared.
This AI theme has been on a warpath. AI threatens software stocks, law firms, brokerages, white-collar work, and the underlying real estate on which so many companies pin their operations. This narrative will be a dominant one for the next 18 to 24 months. What will also matter is how these concerns around disruption bleed into election issues this fall.
That said, when we see these signals go red, pay attention to key moving averages on the S&P 500 and the Nasdaq. Last Thursday (Feb. 5), the S&P 500 bounced right off its 100-day moving average. It then gave us a nice, two-day 'Dead Cat' bounce.
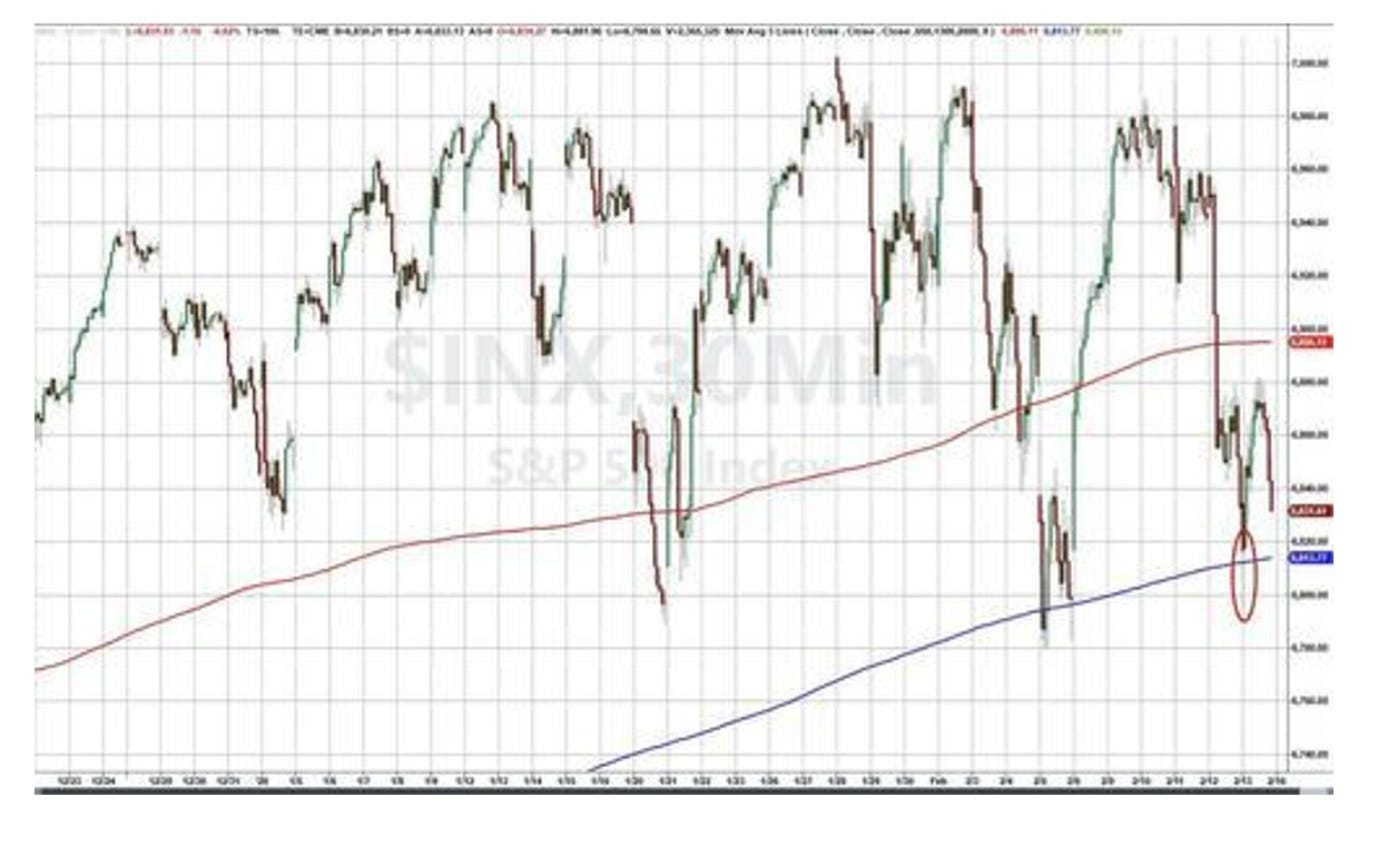
Image Source: ZeroHedge
That black line is the 100-day moving average for the S&P 500. We’ve double-tapped it in the last few weeks.
Extreme Margin
As we stand at the top of this financial cycle, markets have benefited from support from the Federal Reserve, ongoing Treasury action at the front end of the yield curve, Japan’s stimulus and fiscal plans, and now China’s 3.2 trillion yuan targeting.
But this next chart still looms. Because when we see margin debt cycles peak, that’s where the threat of valuation compression emerges if there is a broader unwind. The last top (2021) was a month before the markets pushed higher into November, and then began the long, sluggish march down 25% over the next 12 months.
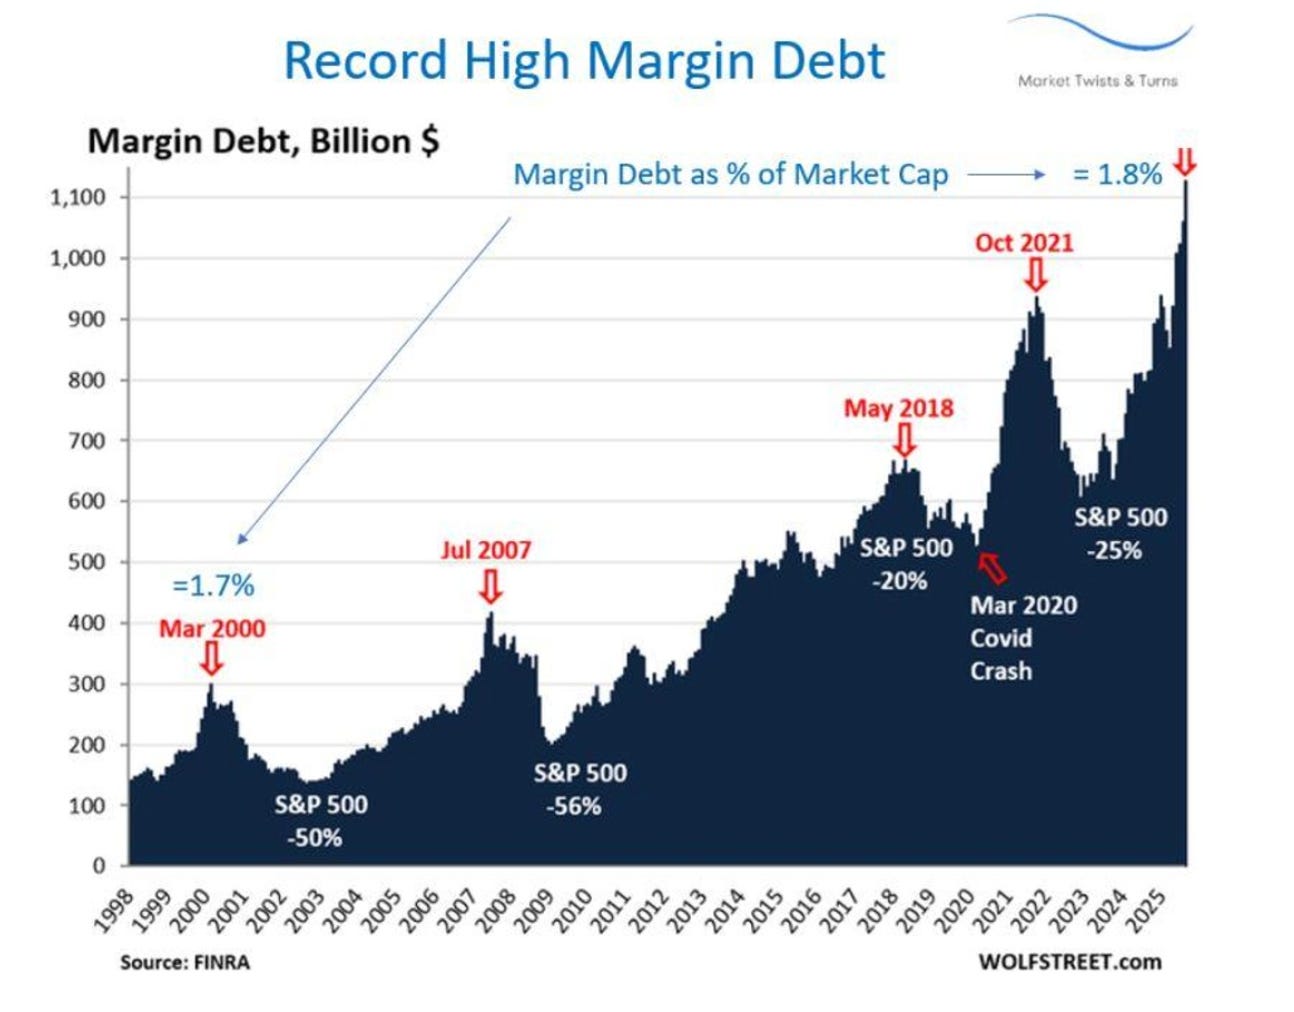
Image Source: WolfStreet.com and BraVoCycles Newsletter
If this market does experience a broader pullback, I will remind you that the S&P 500 and the Nasdaq will not go straight down like an elevator. It instead tends to be a process of lower highs and lower lows, occasional squeezes, shifts from oversold to overbought, and then a shift to the next leg down.
All the while, money will likely flow into defensives first -- and then, ultimately, mid-tier bond duration.
I think it may be a good time to start talking about corporate bonds on the backside of the year, and the debt of countries with strong natural resource profiles and high economic freedom indices -- if you’re looking for peace of mind. You have time to do your research. But there are opportunities to keep a lookout for.
Then, if it all goes down, we will start our game plan for the next cycle by looking at distressed debt, high-beta names, and whatever else people are crying about while predicting the next Great Depression and Hyperinflation.
We trade the cycles until they break.
Am I Still Long Gold?
To answer that, yes. And I’m providing zero additional insight because the following chart speaks for itself.
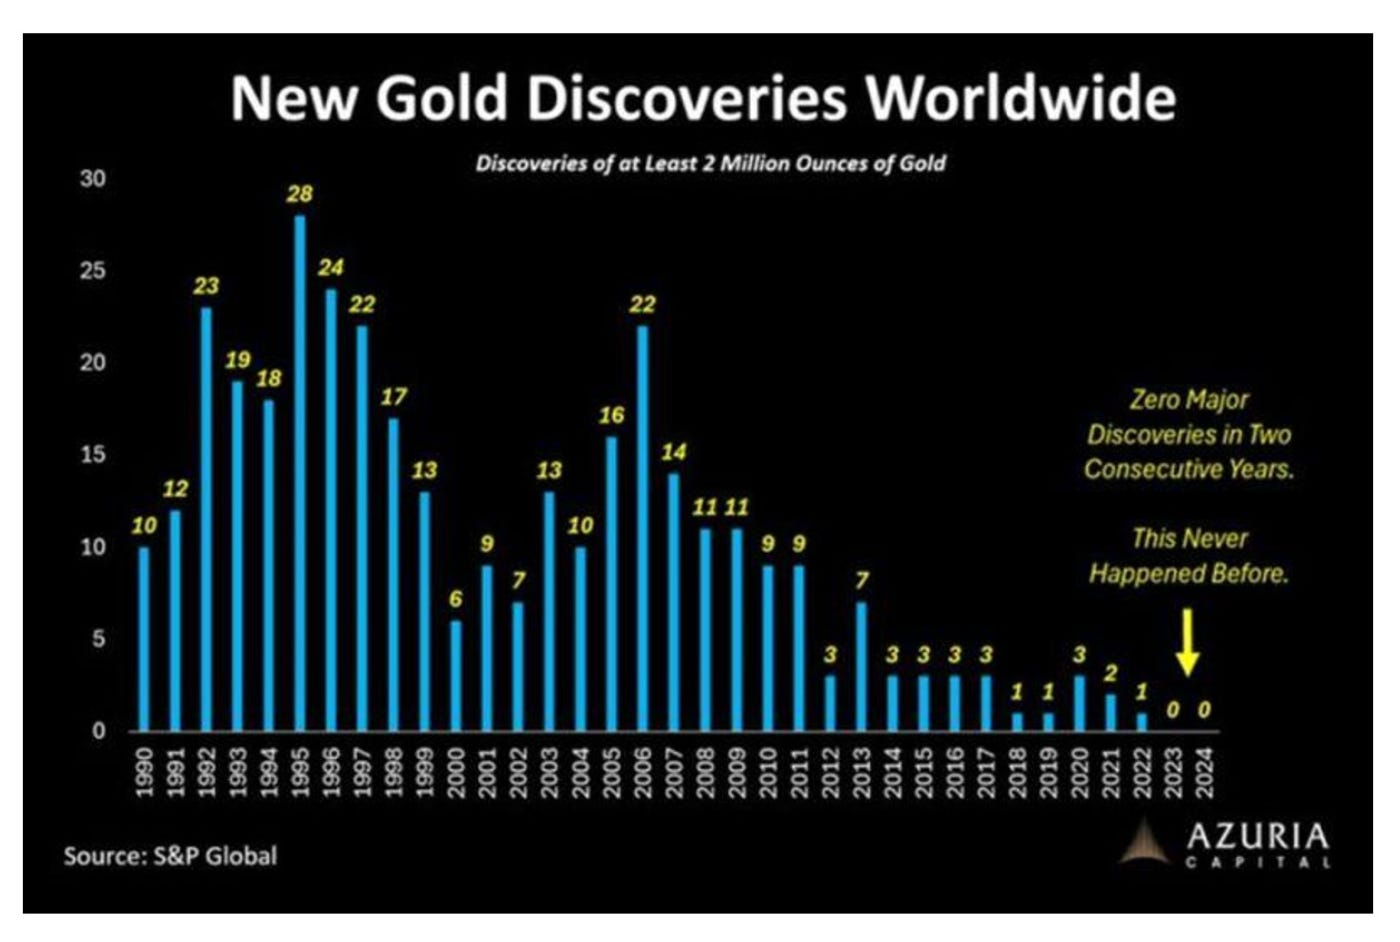
Image Source: Azuria Capital, Tavi Costa
Now You Know
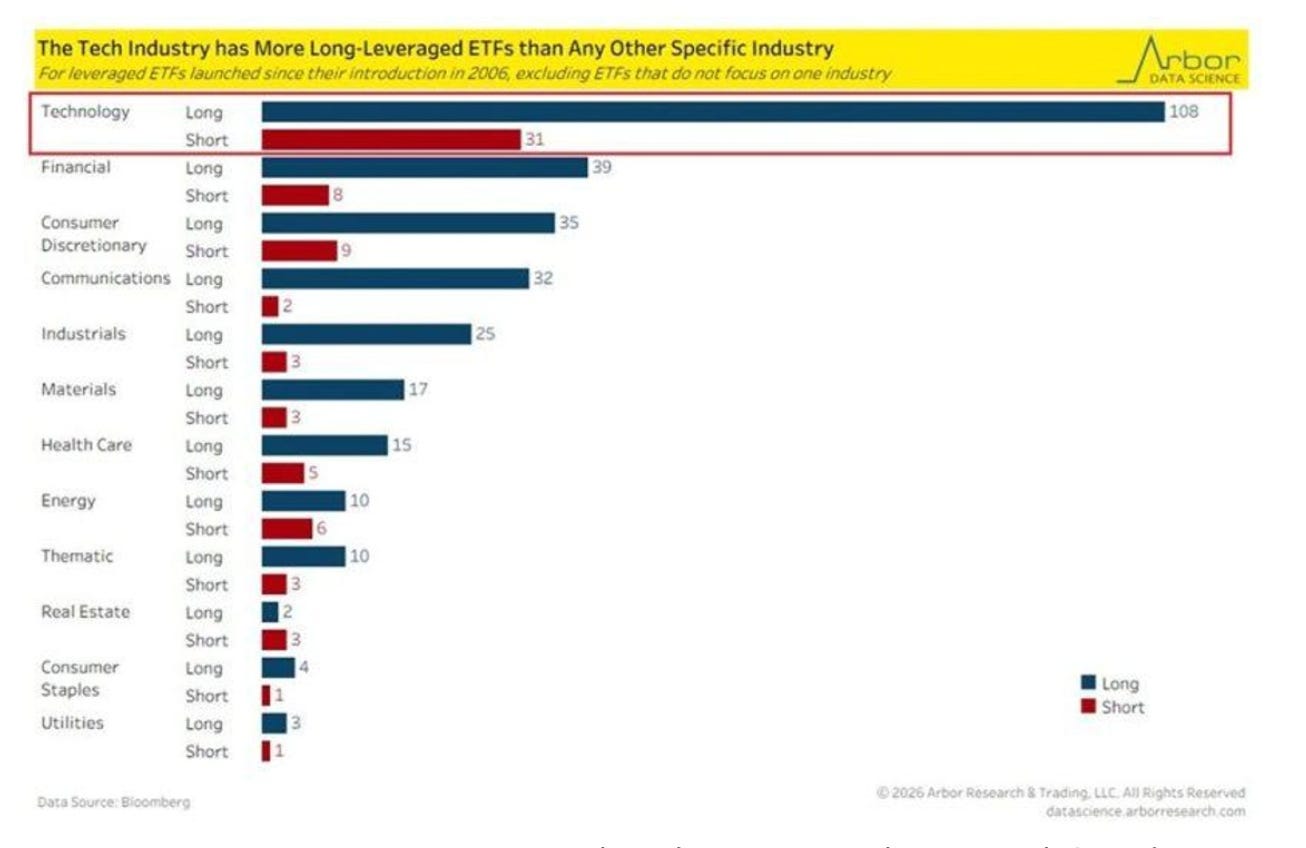
You know what this economy needs? More leveraged technology ETFs, thus providing more ways to gamble on daily moves on Apple stock.
(Click on image to enlarge)
Image Source: Arbor Data Science and The Kobeissi Leter
This is just manic to me. There are 4,219 U.S. stocks that you can buy and trade. There are also now 5,003 ETFs.
And the new ones that keep popping up are exotic, derivative-linked, leveraged single-stock ETFs. There will be implosions in this space in the next 24 months. But no one’s going to do anything about it, there’s too much money to be had in financial engineering.
In Case You Missed It
Finally, I did a lot of writing this week:
- Monday: Things I Think I Think... (There Are Good People In the World)
- Tuesday: Out There on the Edge
- Wednesday: Money Printer 301: Productive, Scarce, or Nothing Else?
- Thursday: Change is Good (Get on Board)
- Friday: Money Printer 302: The Number That Told Me Hell Was Coming
I hope everyone has a great weekend. Postcards from the Edge of the World arrives tomorrow, and remember that the markets are closed on Monday.
More By This Author:
Things I Think I Think...Next Time, Remember These Charts
What If Bitcoin's "Utility" Is to Blow Up?



Comments
Log in or sign up to join the conversation.