

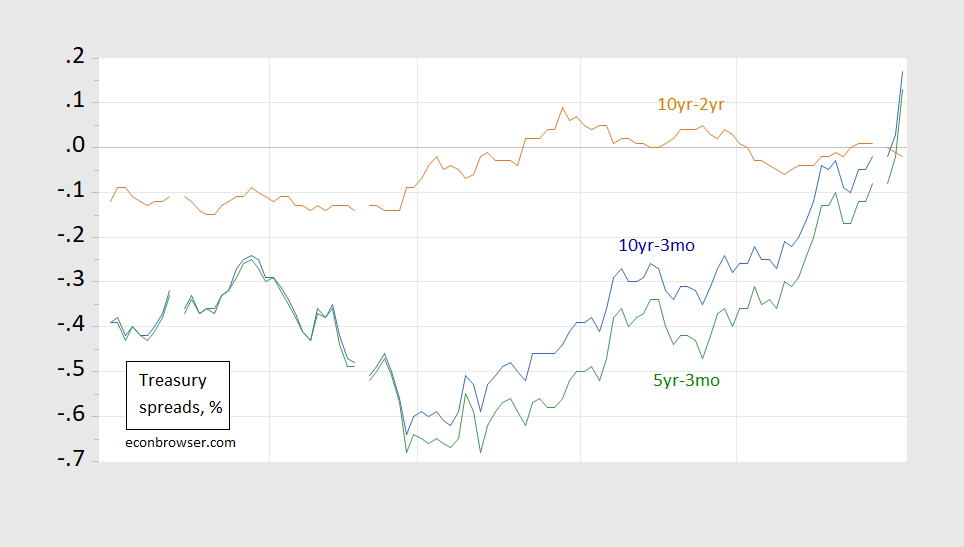
Figure 1: 10 year-3 month constant maturity Treasury spreads (blue), 10 year-2 year (red), 5 year-3 month (green), in %. Source: Federal Reserve, Treasury.
Maybe not…Here’s the same graph with the dates:
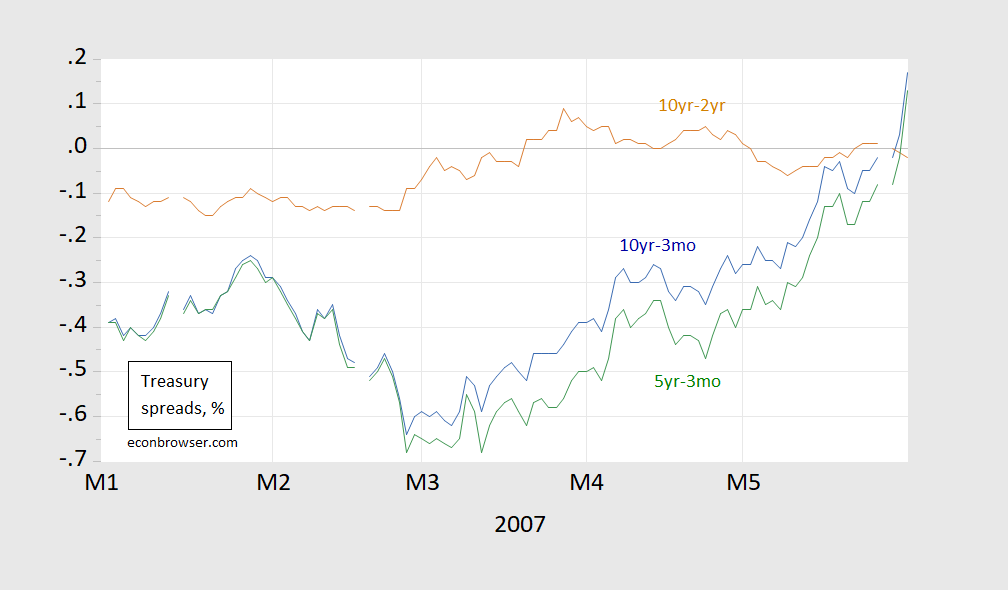
Figure 2: 10 year-3 month constant maturity Treasury spreads (blue), 10 year-2 year (red), 5 year-3 month (green), in %. Source: Federal Reserve, Treasury.
The recession began (as dated by NBER) in December 2007.
What does the current situation look like?
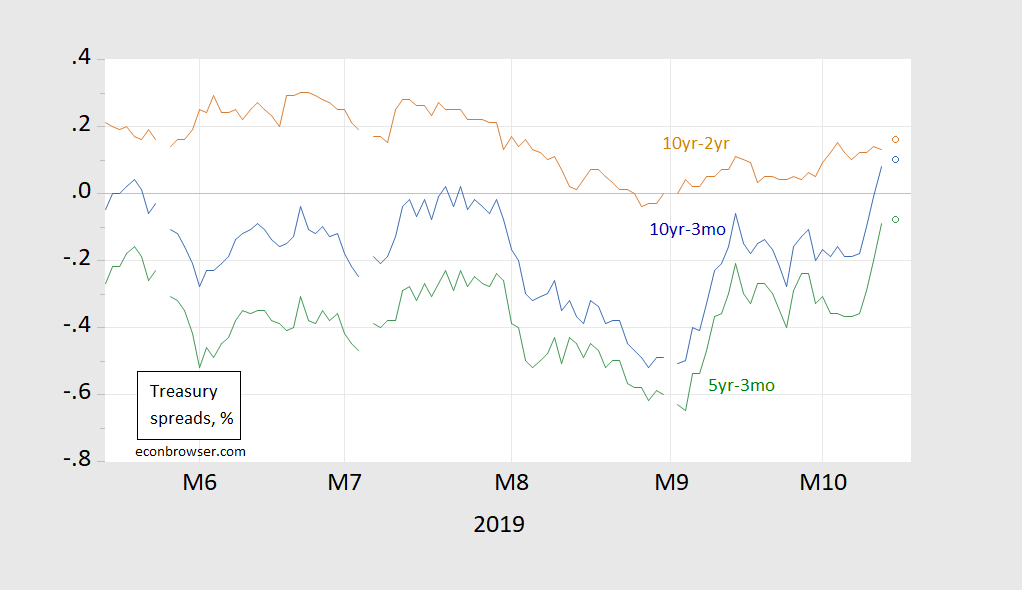
Figure 3: 10 year-3 month constant maturity Treasury spreads (blue), 10 year-2 year (red), 5 year-3 month (green), in %. Source: Federal Reserve, Treasury.



Comments
Log in or sign up to join the conversation.