
With the equity markets sitting at record highs and in a state of euphoria, bond investors are of two minds. The first group of bond investors have set up huge short positions, anticipating a wholesale upward shift in the yield curve, in sync with the attitude in the stock market. The second group of bondholders remain rather pessimistic regarding economic growth, just the opposite view held by equity investors. Let’s look at these two views of the bond market.
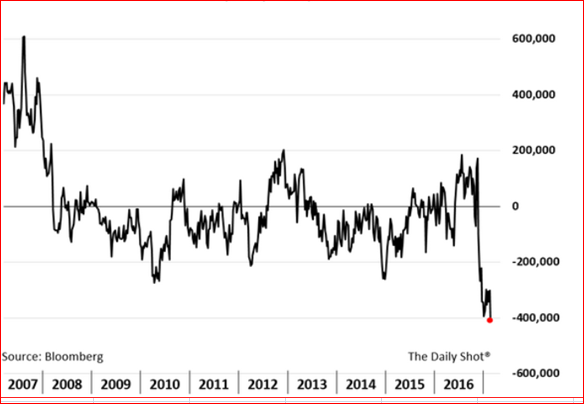
Over the past 6 weeks, the first group, the short traders, have been out in full force. Figure 1 documents the net speculative positions in the bellwether 10 –year US Treasuries. There has not been such a one-sided net short trade at these levels since the dark days of 2008. In fact, there are net short positions in each segment of the bond market, 5-, 10-and 30-years. Everyone is leaning to one side of the boat, raising the risk that the boat might capsize at any moment. According to Deutsche Bank, this net short position is now at four standard deviations from the mean and this represents a very high-risk level should this bet go wrong. Many of these positions are leveraged and accordingly can be classified as being in “weak“ hands. Any stumble in economic data could lead to a short squeeze, resulting in a dramatic drop in yields.
Figure 1. Net Short Positions in 10 yr UST
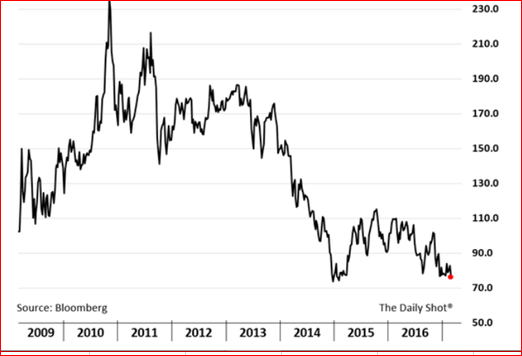
The second group of bond investors look at the underlying conditions affecting interest rates and come up with an entirely different perspective on future rates. Figure 2 shows the dramatic flattening of the yield curve in which the 30-yr-7yr bond spread has been steadily narrowing to the point where it now is below the 2008 level. This group takes the longer term view of the economy, citing slower potential growth, weak productivity and a continuation of a global excess in savings that support low yields. Collectively, these factors have kept long-term rates down, despite the Fed’s tightening policy.
Figure 2. UST 30-7yr Spread
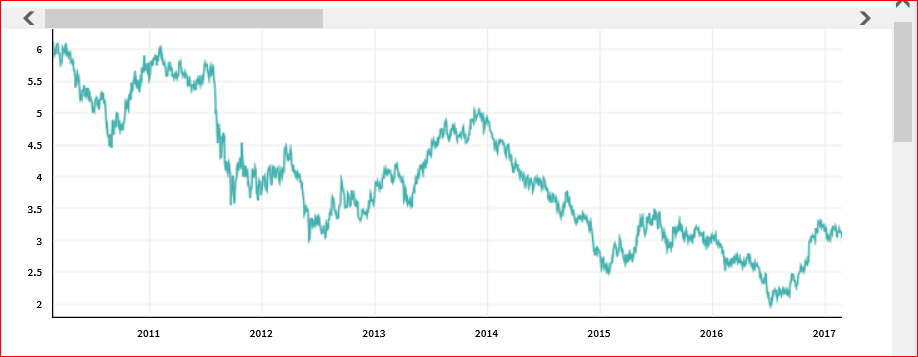
A final chart to consider is what bond investors expect the 10-year bond to yield in a decade from now—the 10y/10y Treasury forward contract, Figure 3. Here again, the yield has perked up since its all-time low of less than 2 per cent in mid-2016. Nonetheless, the 10-year bond is expected to be trading at less than 3 per cent 10 years hence, compared to the 2.5 per cent currently. Moreover, the yield in a decade forward has steadily declined over the past five years as investors continue to downplay inflation expectations.
Figure 3. 10 yr Bond Yield in 10 years
Thus, we see that the bond market is trading in a very narrow range of late as both investor groups maintain their respective positions. Markets never remain static for long, so we can anticipate that while yields will change direction, the timing remains open. What is apparent is that the bond market does not share the enthusiasm of the equity markets, in large measure, because there is little so far in the new administration’s spending plans and tax policies that would re-invigorate the U.S. long-term growth.


Comments
Log in or sign up to join the conversation.