

Ugh! So much endless discussion this week about a quarter-point increase in the Fed Funds rate. Jez, it isn't that big of a deal.
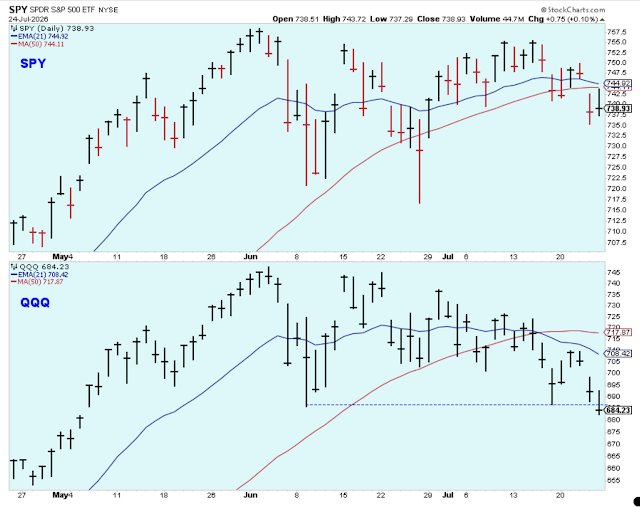
The market continues to look constructive, but there are some important indicators flashing caution that are worth paying attention to.
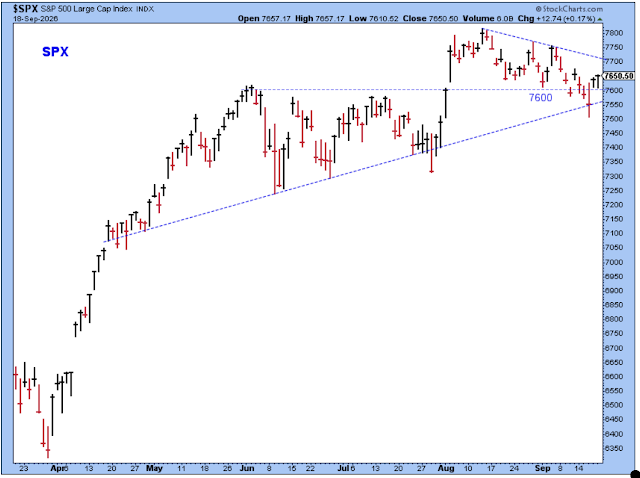
The chart below shows the standard cap-weighted SPX. It briefly dipped under the 7600 support level but quickly popped back above, which I interpret favorably. Nothing in this chart suggests either a breakout or breakdown in the week ahead.
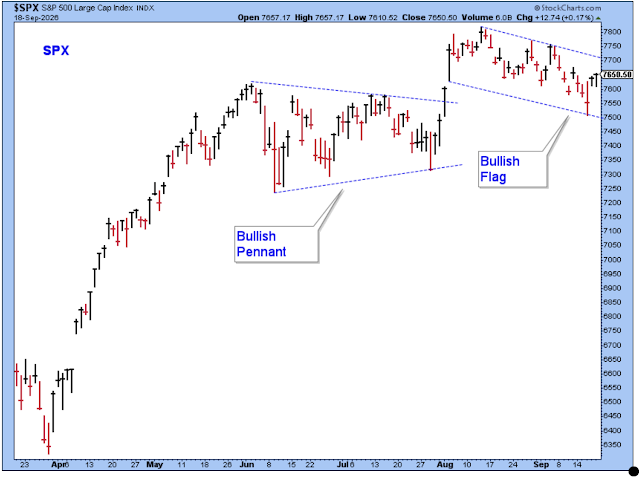
This is the same chart but with a couple of bullish price patterns highlighted.
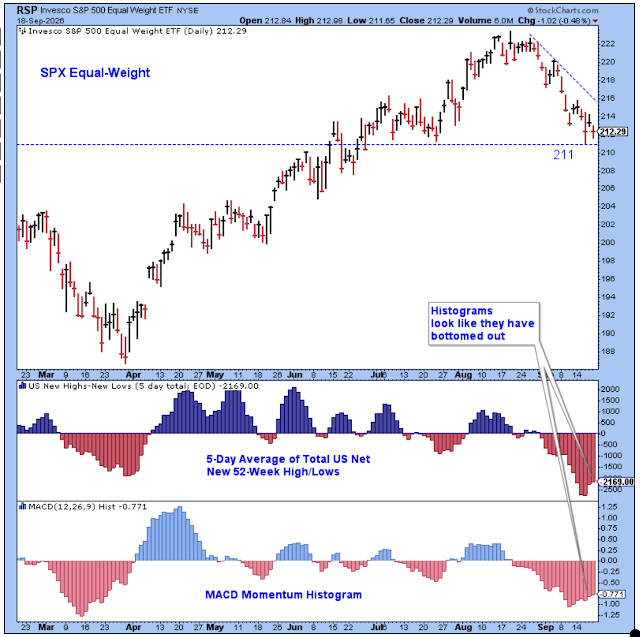
Here is the SPX equal-weighted ETF RSP. It has a very different look than the cap-weighted SPX. The pullback has been sharp and decisive, but the prior rally goes all the way back to the March low, and a pullback that looks like this seems very reasonable.
I've noted that the two corresponding histograms look like they have bottomed out, which could be a good sign that the price of the ETF is also near a bottom... in the short-term.
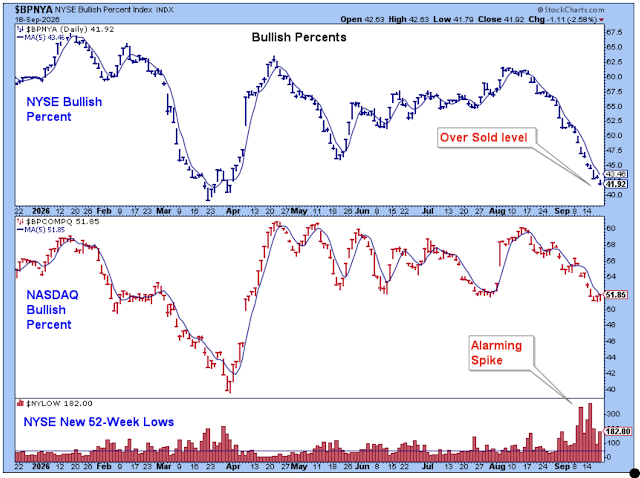
The NYSE bullish percent is looking surprisingly oversold and near the same level as the March correction. The spike in the NYSE new 52-week lows is alarming for sure, but when we get spikes in new lows while the market is oversold, it often indicates a short-term bottom is near.
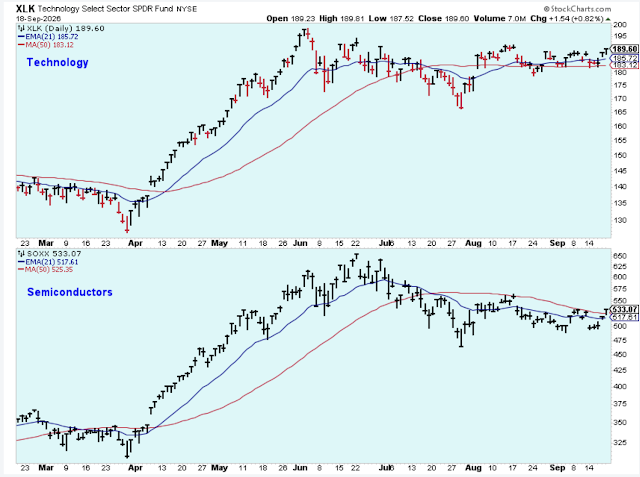
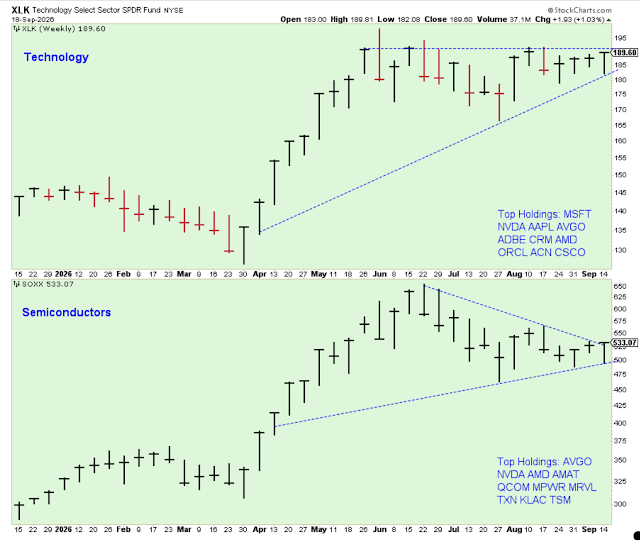
The two leading ETFs continue to look good. Both have popped up above their moving averages and closed at the highs on Friday. It really isn't much, so let's not make a big deal, but it's worth noting. They have the look of ETFs that will work their way higher. XLK, SOXX
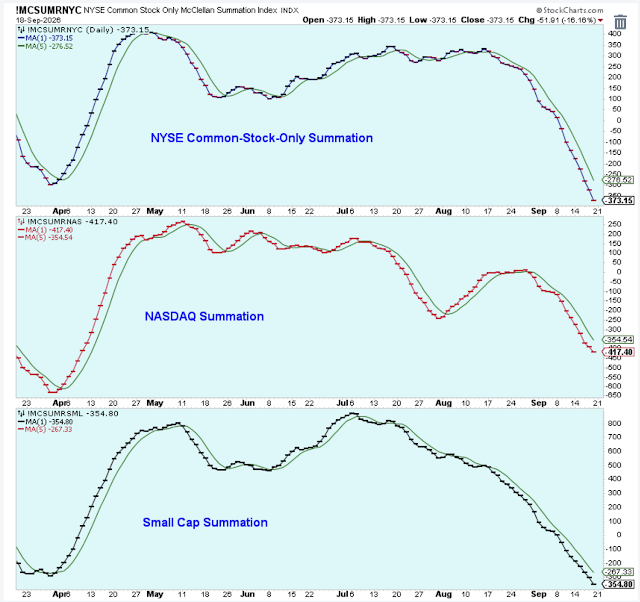
The summations continue to point lower even though they are at oversold levels. I'm looking for a turn higher for these indicators as confirmation of a short-term trend reversal.
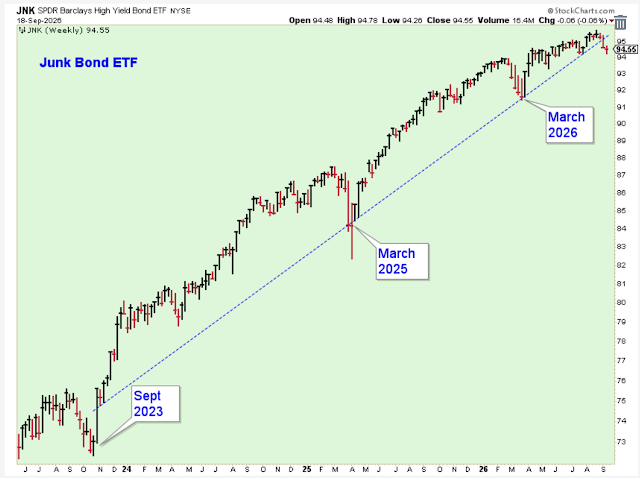
This is unfortunate. The junk bond ETF JNK broke its trendline. However, it isn't a dramatic break, and I'm not ready to make too big of a deal about it yet. However, even though it is too soon to indicate a major turn, it is important to maintain a level of uninvested cash until the price of this ETF recovers.
Bottom Line: I had to sell my position in SCHD because it broke below its trendline. So, I have cash to help cushion the blow to my accounts if the market goes down from here. However, I'm expecting that there will be signals to get back into stocks as we get closer to the midterm election.
--------
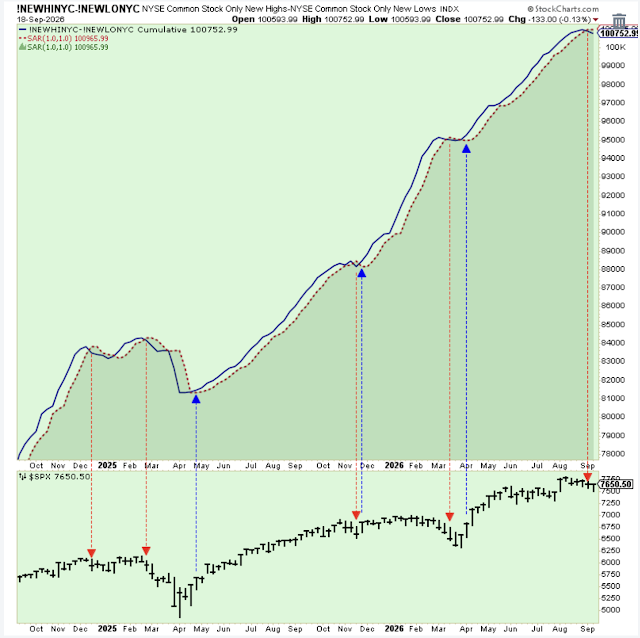
This isn't good. The longer-term market trend indicator has gone negative. For me, it means that caution is called for (similar to the warning from the junk bond price just mentioned) until it turns positive again. Being cautious means having fewer buys, tighter stops, smaller positions, and a percentage of cash in the account.
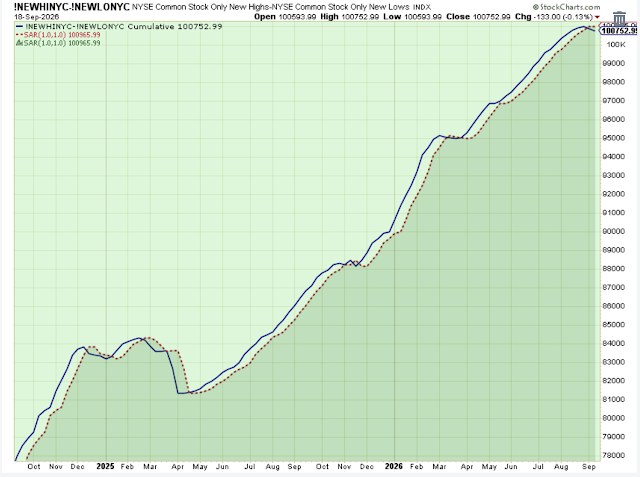
The last two negative signals from this indicator were fairly quickly reversed. The signal in March of this year was late and didn't help as much as I would have liked.
The negative signals in late-2024 and early-2025 were very helpful. Paying attention to these signals really paid off. Also, I think having negative signals back-to-back, separated by only a few months, added to the importance of the signals.
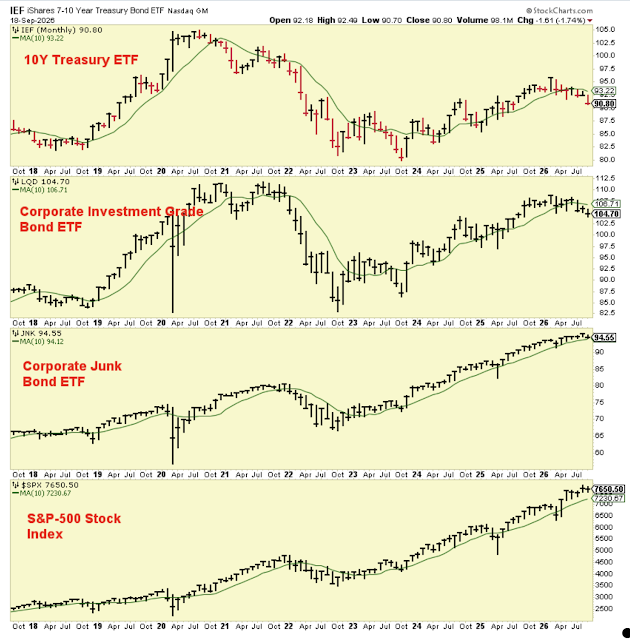
Here is a look at the monthly chart that shows the relationship of the 10-year Treasury IEF price to corporate bond LQD and stock prices SPX.
You see that the investment-grade corporates, which track the 10Y Treasury very closely, have already turned lower and are below the 10-month average.
If the 10Y Treasury price continues lower, it is very likely to drag down both junk bond prices and stock prices. However, as you can see, it takes a number of months for this to occur.
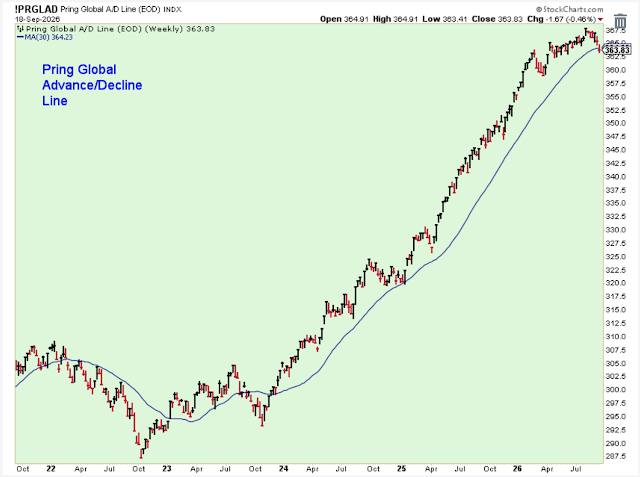
Here is a bit more bad news. The global advance/decline line is close to breaking down after trending higher for a couple of years.
There really aren't too many ETFs that I follow that look ready to break out, but there are a few, and it just so happens that they are by far the most important ETFs to the overall health of the general market.
We took a look earlier at the daily charts of these ETFs, which looked good, but here are the weeklies, which are also looking good.
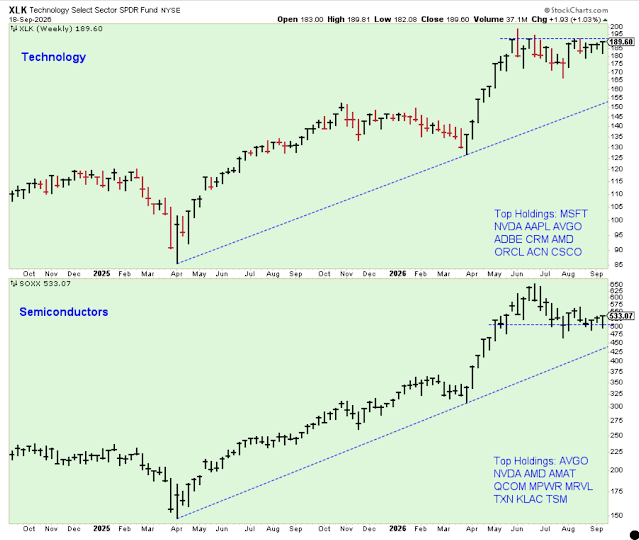
And yet another look at the same ETFs. Bullish
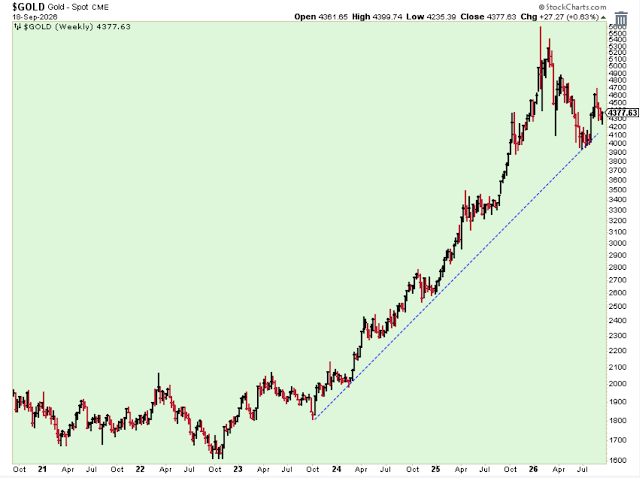
Gold is looking interesting. There isn't a buy signal yet, but the price action is constructive and is behaving in an expected and traditional fashion. The price was extended in January 2026, so it pulled back to the uptrend, where it bounced, pulled back again, and is now looking ready to bottom out. This is classic price action. Bullish
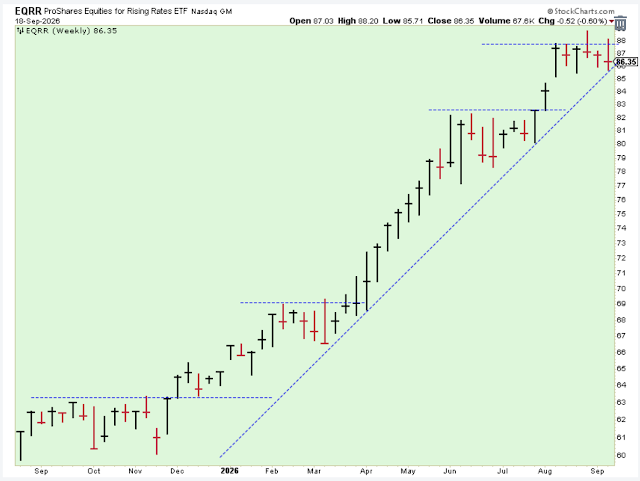
I have been adding gradually to my holdings in this ETF. Basically, it invests in the stocks that do best while yields and rates are rising. EQRR

Comments
Log in or sign up to join the conversation.