

The S&P 500 (SPY) fell 0.71% yesterday as its 10-day advance/decline line moved closer to oversold territory. The 10-day A/D line reading is now at its lowest level since 5/4, the last time it was oversold.
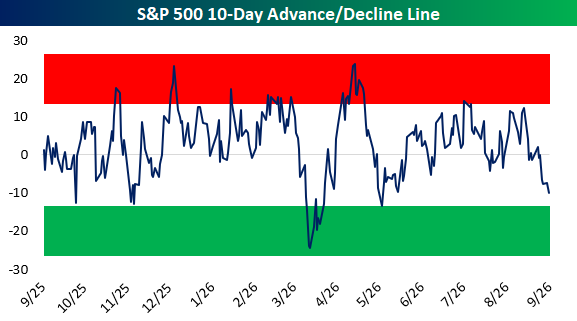
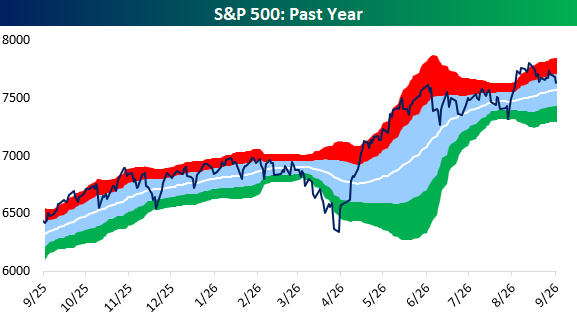
The 10-day A/D line measures the average daily difference between advancing and declining stocks over the prior ten trading days, making it a useful measure of short-term breadth. When the 10-day becomes oversold, it’s a sign that stocks have struggled to turn in gains over the short-term. That deterioration has gone hand in hand with weaker price action. Since closing in extreme overbought territory 13 trading days ago, the S&P 500 has posted just four higher closes and endured two separate three-day losing streaks, leaving it only 0.44 standard deviations above its 50-DMA. But even though price has remained above the 50-day, breadth has been even worse.



Comments
Log in or sign up to join the conversation.