


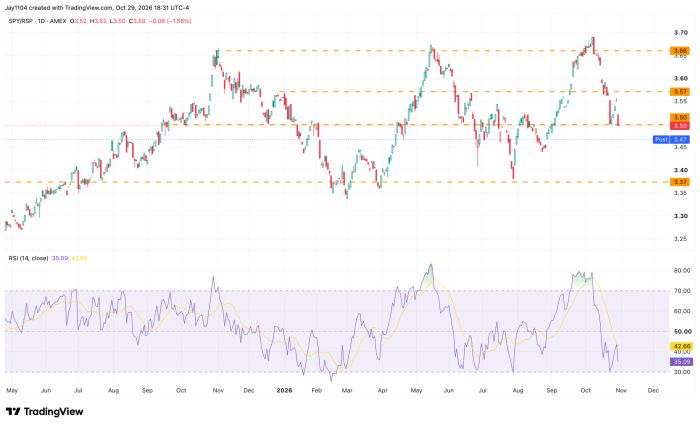
It was a tale of two markets. The cap-weighted and equal-weight indexes continued on divergent paths, and the SPY/RSP ratio fell 1.6% to 3.50, a level it has held every time it has tested this year. Above, 3.66 has now been rejected three times since November, and the third rejection has been the sharpest. If Amazon (AMZN) stays down tomorrow and 3.50 gives way, SPY is likely to keep underperforming RSP, with 3.37 the next level down.
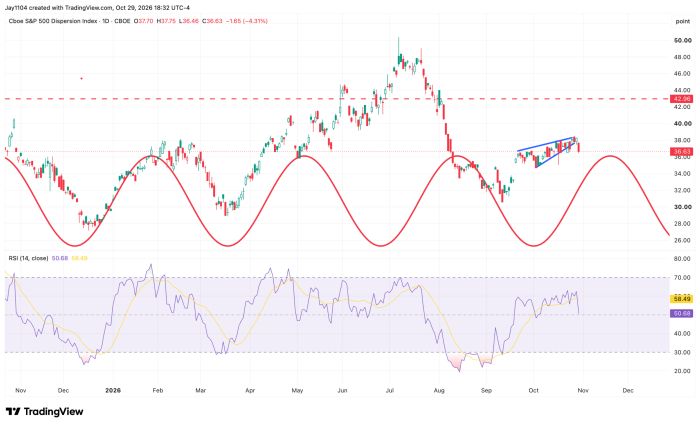
The dispersion trade is also cracking, as anyone would guess. Earnings are passing every day, and single-stock implied volatility is falling faster than the VIX, which showed up in the 1-month implied correlation index rising 1.65 points on the day to 10.38
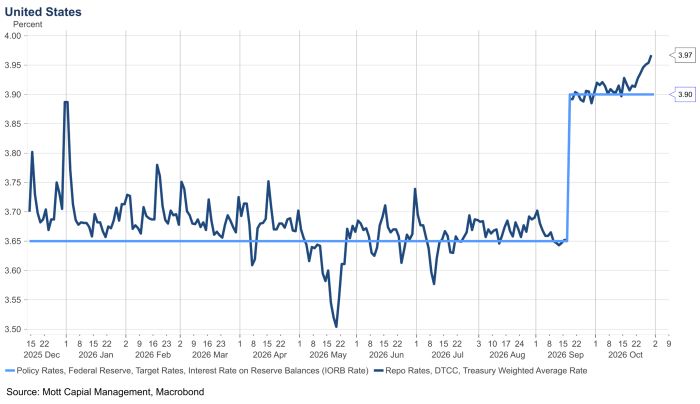
With all of that rotating around, it is no wonder the S&P 500 finished the day down just 30 bps while the RSP finished higher by more than 1%. At some point the rotations won’t be able to hold everything up, and the question is when, and how much damage is done when they stop. That isn’t easy to answer. But I do know liquidity is tightening. Overnight repo rates rose to 3.97% today, up from 3.91% on October 19, which means SOFR will probably print around there tomorrow, nearly 7 bps above IORB.
Reserves are back near $2.9 trillion, below the $3 trillion line that has mattered, and sitting at the low end of their range.
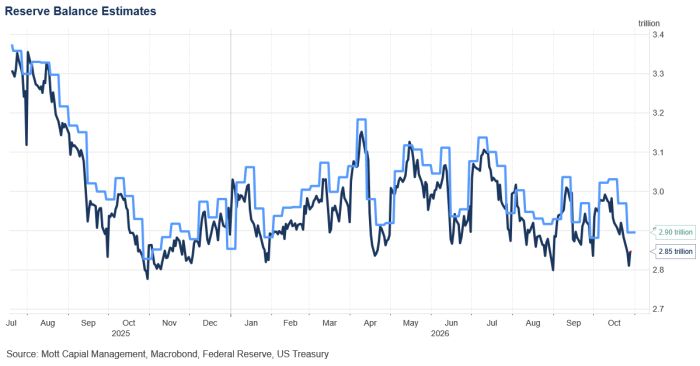
On top of that, T-bill issuance is still running, and that will keep draining liquidity and pressuring overnight rates.
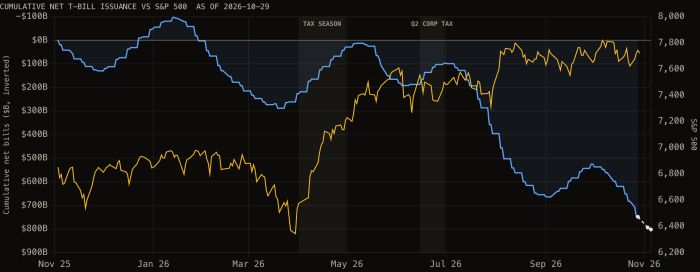
At some point, all of this catches up to the market. CDS spreads are widening, liquidity is tightening, and the rotations are doing more work every day to hold the index together. The cracks are starting to show.



Comments
Log in or sign up to join the conversation.