

The S&P 500 in the third week of July 2016 ran a bit to the hot side for what our future-based model forecast, but still well within the typical volatility that we would expect. In the chart below, we find that investors are largely continuing to focus on the expectations associated with 2017-Q2 in setting current day stock prices. But we also see that our futures-based model is on the verge of a period of time during which we expect that it will be less accurate than it has been in recent months.
(Click on image to enlarge)
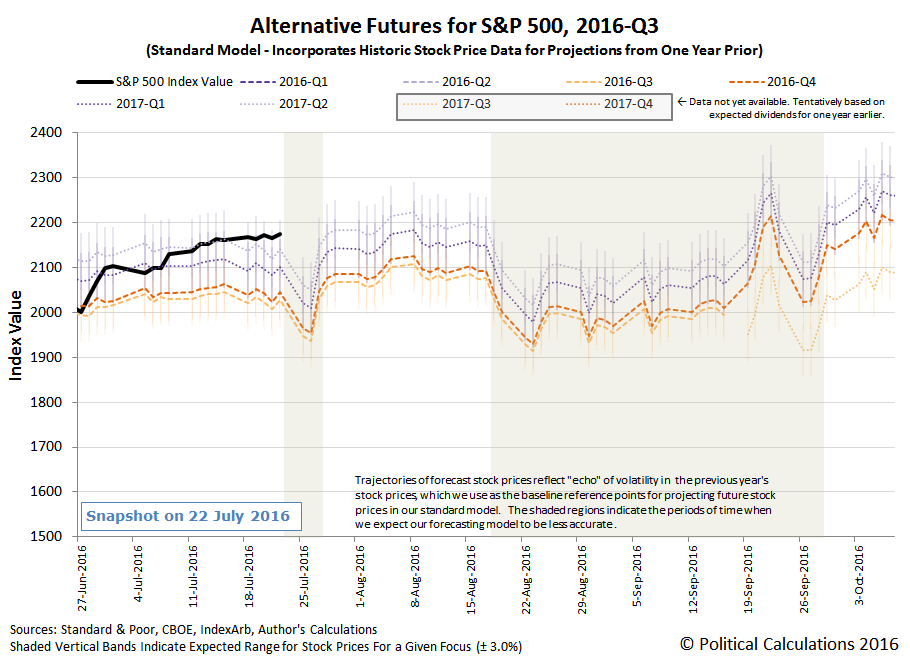
For the last several years, we have been developing a dividend-futures based model for projecting future values of the S&P 500, which incorporates historic stock prices to use as base reference points from which to project the future. More specifically, our standard model incorporates actual S&P 500 closing values that were recorded 13 months earlier, 12 months earlier and 1 month earlier than the period being projected.
In using those historic stock prices however, we have a huge challenge in coping with what we call the echo effect, which results when the historic stock prices we draw upon to create our projections are pulled from periods that experienced unusually high amounts of volatility. A good example of the kind of volatility we're looking to address would be the kind the market saw just a month ago from the market's reaction to the Brexit vote, but much more significantly, on the one-year anniversary of what the market experienced during China's meltdown back in August 2015.
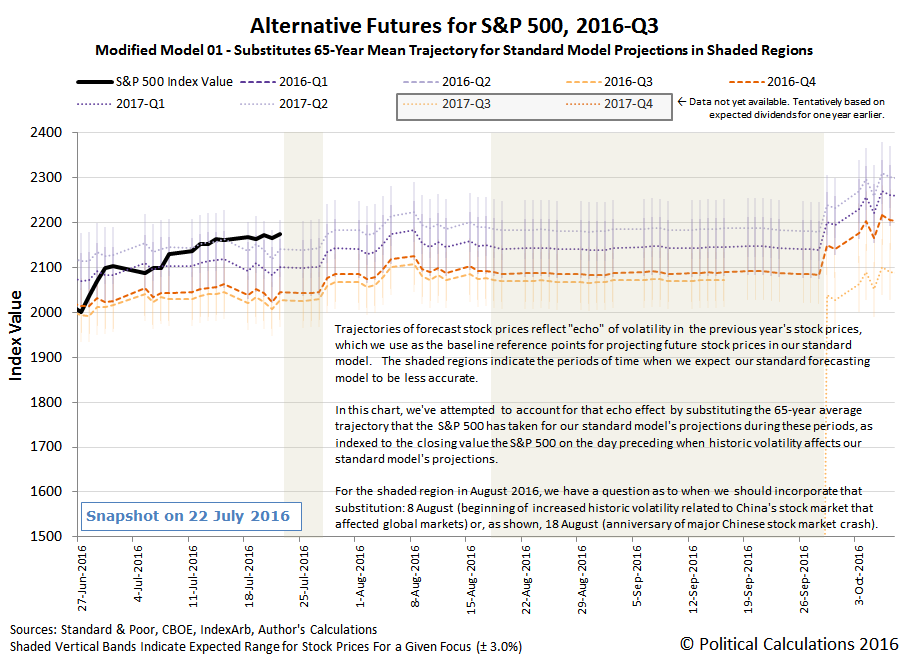
To work around that looming challenge and to try to improve the accuracy of our forecasting model during the periods where we know in advance that our model's forecast results will be less accurate because of the echo effect, we're looking at substituting the actual historic stock prices in our model with prices that reflect the historic mean average trajectory of stock prices.
There's more than one way that we might go about that, but our initial idea is to simply replace the projections of our standard model during the that show the echo effect with the trajectory that would apply as if it were paralleling the mean historic trajectory of the S&P 500 as averaged over each of the last 65 years, which may minimize the discrepancies produced by historic noise between our model's projections and actual future stock prices (absent current day volatility events).
What we're doing assumes that the volatility of the past doesn't have much influence over today's stock prices, which itself is something we strongly suspect, but for which the supporting evidence is less definitive. We also don't know yet to what degree this approach will work, but we'll find out during this quarter. If you follow us, we typically post updates to our projections on Mondays, so you can find out how what we're doing is working almost at the same time we do. Here's the first chart where we're featuring this modified model, which we've imaginatively called "Modified Model 01".
(Click on image to enlarge)
Because the context of how far forward investors are looking in time is so important to determining which of the alternative trajectories that the S&P 500 applies, we make a point of recording the headlines that catch our attention for their market moving potential influence each week. Here are the headlines we identified during Week 3 of July 2016, where much of the news cycle was dominated by reports from the Republican National Convention in Cleveland, Ohio. If you're a serious market investor, you should note how none of them have anything to do with any of the political news from the week, which was a non-event as far as the market was concerned!
Monday, 18 July 2016
- Oil prices slide amid rise in crude, fuel supplies
- Wall St. sets records again, led by tech, bank stocks
Tuesday, 19 July 2016
- U.S. housing starts rise in June; momentum slowing
- - related: Dollar hits four-month high after better-than-expected U.S. housing starts
- S&P pulls back from record; Dow notches eight day of gains
Wednesday, 20 July 2016
- Futures rise on Morgan Stanley, Microsoft results
- Dollar hits four-month high as markets raise bets on Fed rate hike
- S&P, Dow stay on record-setting run; dollar firm - What are the odds of DJI closing higher on 9 consecutive days according to data going back to 2 May 1885? 1 in 818!
Thursday, 21 July 2016
- Dollar drops vs yen as BOJ's Kuroda plays down 'helicopter money'
- Oil down 2 percent as record U.S. stockpiles heighten glut worry
- Intel, transports sap Wall Street's strength - If the Dow had closed up a tenth day in a row, it would have beaten odds of 1 in 1,565! The longest streak of consecutive up days for the DJI is 14, which comes with odds of 1 in 36,005.
Friday, 22 July 2016
Comments
Log in or sign up to join the conversation.