

For the S&P 500, the third week of August 2017 looked an awful lot like the second week of the month.
(Click on image to enlarge)
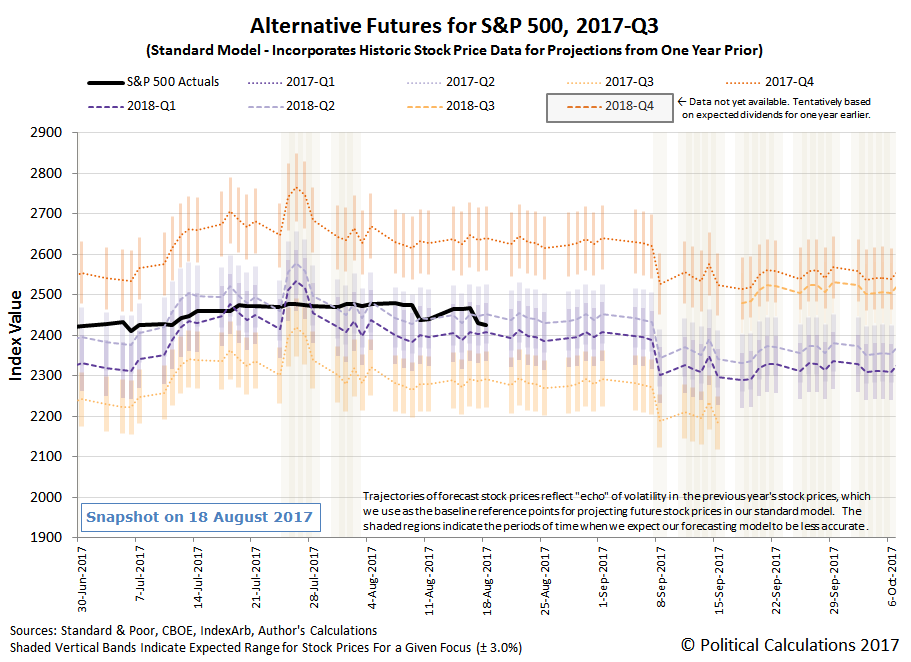
Specifically, if you look at the period from the close of trading on Monday to the close of trading on Friday, the S&P 500 almost repeated the same trajectory that it did a week earlier, as it moved sideways from Monday through Wednesday, dropped 1.5% on Thursday, then moved sideways within a narrow band on Friday.
That kind of pattern raises an interesting question: Is the current period of relative order in the market, which has been in place since 31 March 2016, now breaking down?
We'll tackle that question at greater depth tomorrow, however the short answer to it is "potentially", where the answer may very well change to "yes" if the S&P 500 should drop by another 17-18 points below its Friday, 18 August 2017 close sometime during this upcoming week.
Now that we've shaken you up a bit, let's look backwards to understand the context that applied to the U.S. stock market in Week 3 of August 2017.
Monday, 14 August 2017
- Dudley tells skeptical markets he sees Fed rate hike: AP
- Wall Street jumps as North Korea tensions wane; S&P 500 up one percent
Tuesday, 15 August 2017
- Oil prices settle flat after testing three-week lows
- Wall Street ends flat; economic data offsets retailer results
Wednesday, 16 August 2017
- Oil edges up on decline in crude stocks, but high production caps gains
- Fed policymakers grow more worried about weak inflation
- Wall Street ends up but off highs after Trump announcement, Fed minutes
Thursday, 17 August 2017
- Oil rises more than one percent on bets U.S. inventories falling
- Cautious Fed official wants evidence of medium-term price rise
- Washington's mounting woes push S&P to biggest loss in three months - the "biggest loss in three months" being a 1.5% decline in the index, from 2468.11 to 2430.01.
Friday, 18 August 2017
Comments
Log in or sign up to join the conversation.