


The S&P 500 (Index: SPX) was nearly unchanged over the past week. The index dipped 0.28% from where it closed the preceding Friday, winding up the trading week ending on Friday, 2 October 2026 at 7,722.72.
While it might seem mostly balanced, that tiny, bearish change is masking some much bigger changes within the index over the past month.
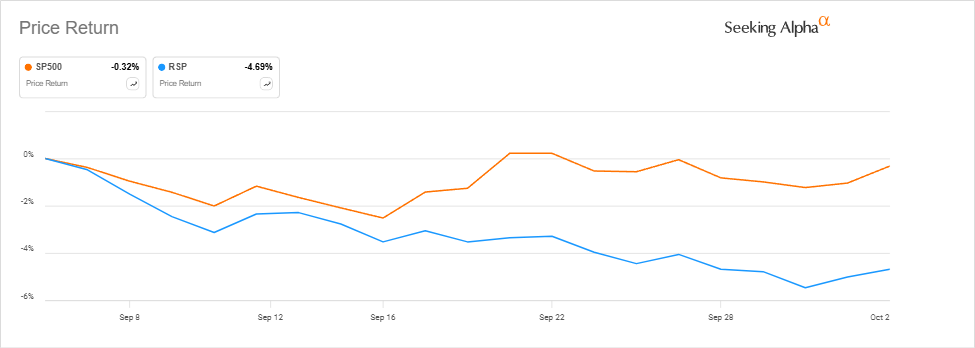
That difference can be seen by comparing the trajectories of the regular market cap-weighted index and the equal-weighted version of the S&P 500, which we'll represent with Invesco's S&P 500 Equal Weight ETF (NYSE: RSP). The market cap-weighted S&P 500 declined 0.32% over the month from 3 September 2026 to 2 October 2026, while the equal-weighted version of the S&P 500 fell 4.69%.
The difference between the two versions of the S&P 500 index is being driven by the global bond rout that's been taking place over this time, which has seen U.S. long-term bond yields rise as both Japan and France have seen their bond yields spike as both are experiencing debt crises.
In the U.S., the ongoing global bond rout has pushed up the yields of U.S. Treasuries to their highest levels in decades, also boosting U.S. interest rates. Consequently, interest rate sensitive stocks in the S&P 500 have been beaten down as bond yield have risen, subjecting the overall index to downward forces.
But the market cap-weighted S&P 500 has avoided plunging because it is being buoyed up by big tech stocks from the companies making big investments in Artificial Intelligence (AI) technologies, whose stock prices have increased in this period. The rise of big AI stocks is mostly offsetting the gravitational pull of the global bond rout. At least, so far.
The following chart shows the divergence between the market cap-weighted S&P 500 and the equal-weighted version of the index.
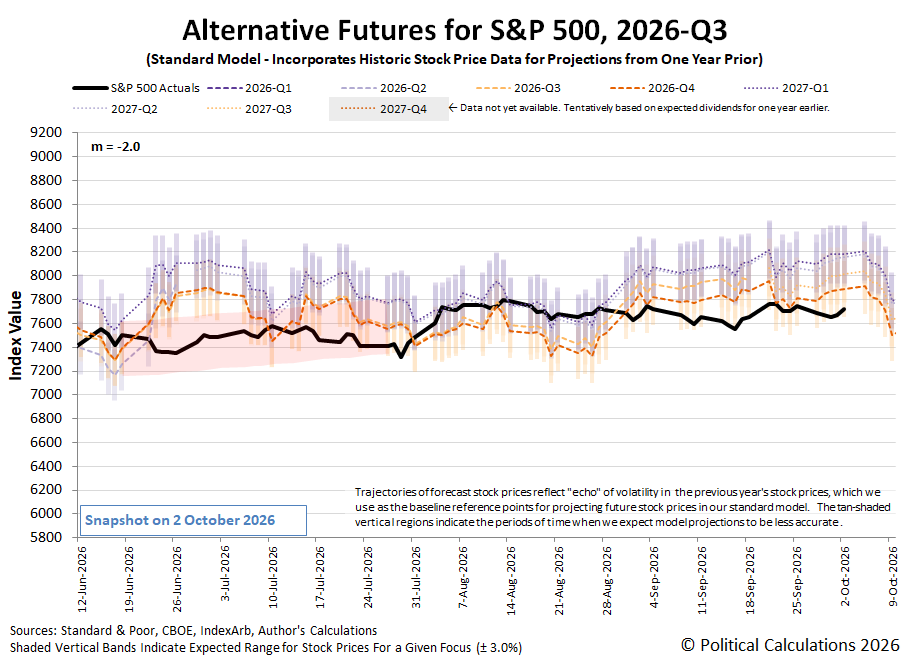
The latest update of the dividend futures-based model's alternative futures chart shows the battle between rising AI tech stocks and all other stocks is keeping the index right about where it would be expected to be provided investors are focusing on the now current quarter of 2026-Q4 in setting overall stock prices.
Here is our sampling of the random onset of new information that moved markets during the trading week ending on 2 October 2026 as the scariest month for stocks gets underway.
Monday, 28 September 2026
Signs and portents for the U.S. economy:
Bigger trouble, stimulus developing in China:
BOJ minions thinking about hiking Japan's interest rates more often because of inflation, JapanGov minion hints at more interventions to prop up currency:
ECB minions thinking about fighting Eurozone inflation, slowly:
Tuesday, 29 September 2026
Signs and portents for the U.S. economy:
China, US pledge tariff cuts on $60 billion of goods including agriculture, toys, toasters
Target lowers prices on nearly 2,000 items ahead of holiday season
Medicare Advantage premiums expected to drop more than 16% in 2027, CMS projects
Fed rate hike odds tumble to coin flip after Williams says no rush
Fed minions see more inflation ahead, not so sure about another rate hike, and worry about not saying enough:
Bigger trouble, stimulus developing in China:
ECB minions thinking about how to make Euro currency more popular:
U.S. equities closed in the red as oil prices slipped and yields remained in focus
Wednesday, 30 September 2026
Signs and portents for the U.S. economy:
Fed now expected to sit on hands rather than hike U.S. interest rates quite so soon:
Fed minion says inflation Fed minions have allowed on their watch for years is too damn high:
Former chief minion's overspending on headquarters remodel was bad management, not criminal
AI-related growth signs developing in China:
BOJ minions thinking harder about hiking Japan's interest rates more often:
Bigger trouble developing in Eurozone:
ECB minions standing by to leap into action, chief minion thinking hard about next career move:
Thursday, 1 October 2026
Signs and portents for the U.S. economy:
Fed minions say they would like to see lower inflation. And maybe a half point rate hike, but not in October:
Bigger trouble developing out of China:
Bigger trouble developing in Eurozone:
S&P 500 closes higher to start October as Treasury yields retreat from multiyear highs updates
Friday, 2 October 2026
Signs and portents for the U.S. economy:
Fed minions expected to take October 2026 rate hike off the table, Fed minions seem confused about next actions:
Bigger trouble developing out of China:
Bigger trouble developing in Japan, BOJ minions get data supporting their plans to hike Japan's interest rates more:
Bigger trouble developing in Eurozone, ECB minions counting on Eurozone debt crisis to counter inflation:
The CME Group's FedWatch Tool no longer anticipates a quarter point rate hike when the Fed meets to consider how to set the Federal Funds Rate on 28 October (2026-Q4). Instead, it now anticipates the Fed's next adjustment to interest rates will still be a quarter point increase, coming when the Fed meets on 9 December (2026-Q4).
Looking beyond that date, the FedWatch Tool projects the Fed will keep hiking rates a quarter point at a time at twelve-week intervals, with at least three rate hikes predicted in 2027. Those forecast hikes would be announced on 17 March (2027-Q1), 9 June (2027-Q2) and 15 September (2027-Q3).
The Atlanta Fed's GDPNow tool's projection of real GDP growth for the U.S. economy in 2026-Q3 declined to 3.7%, falling from the +5.0% annualized growth it forecast a week earlier.
Comments
Log in or sign up to join the conversation.