

The Bureau of Economic Analysis announced yesterday that U.S. real GDP grew at a 1.9% annual rate in the fourth quarter, well below the historical average of 3.1% per year, but close to the 2.1% average since the recovery from the Great Recession began in 2009:Q3.
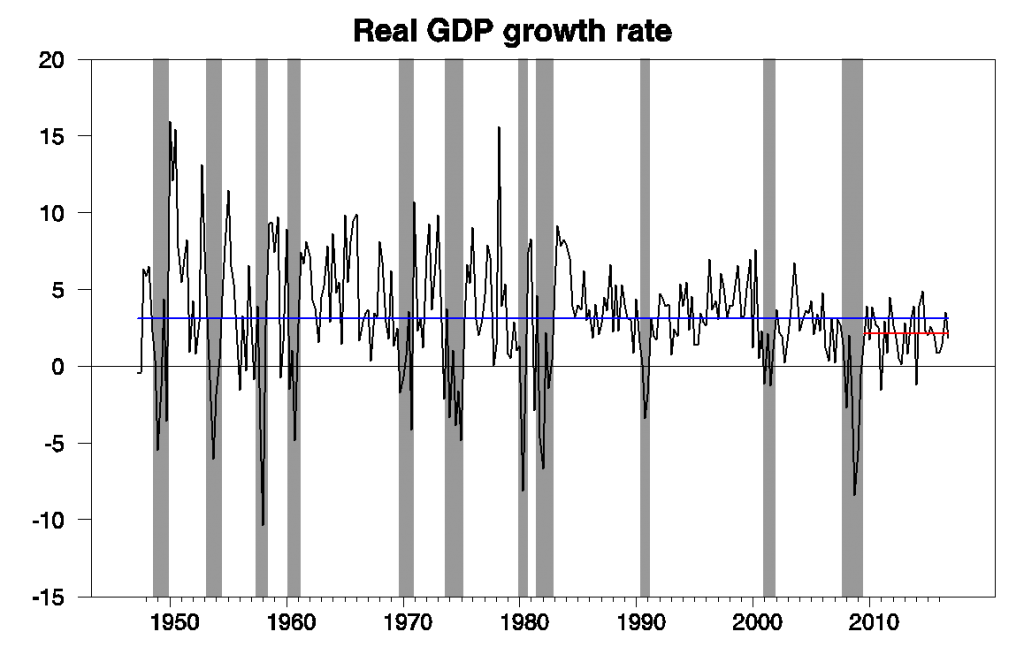
Real GDP growth at an annual rate, 1947:Q2-2016:Q4, with the 1947-2016 historical average (3.1%) in blue and post-Great-Recession average (2.1%) in red.
The ongoing (though modest) growth brought our Econbrowser Recession Indicator Index down to 5.3%, erasing the modest spike up that had followed the weak GDP numbers in the first half of 2016. The index uses yesterday’s release to form a picture of where the economy stood as of the end of 2016:Q3.
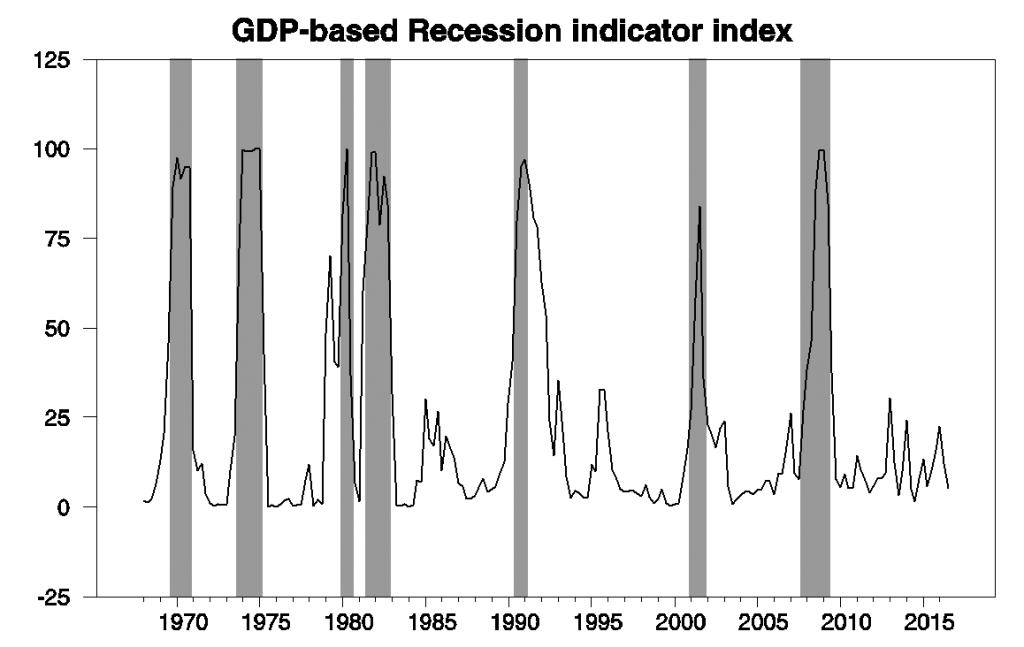
GDP-based recession indicator index. The plotted value for each date is based solely on information as it would have been publicly available and reported as of one quarter after the indicated date, with 2016:Q3 the last date shown on the graph. Shaded regions represent the NBER’s dates for recessions, which dates were not used in any way in constructing the index, and which were sometimes not reported until two years after the date.
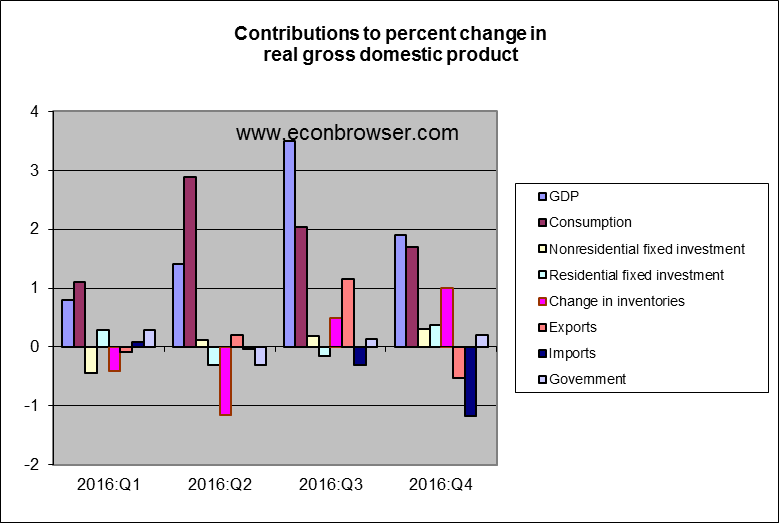
Real consumption spending grew at a 2.5% annual rate in the fourth quarter, a little faster than total GDP. But, as a result in part of the steep appreciation of the dollar, much of the consumption spending went to imported goods. The growth in imports subtracted 1.2% from the GDP growth we would have seen if all the spending had been on domestically produced goods and services. Real exports fell from their high levels of the third quarter. Housing and nonresidential fixed investment made modest positive contributions.
Weak investment spending has been the story for the U.S. for many years now. The fraction of U.S. GDP devoted to investment in nonresidential equipment and structures has been below the historical average every year since the Great Recession.
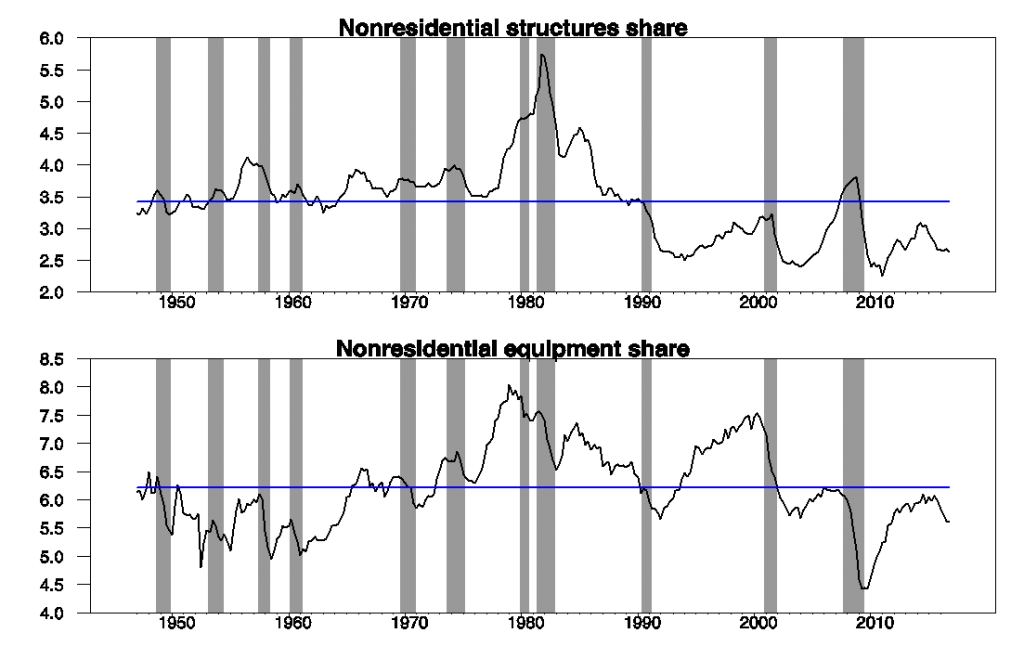
Investment spending as a percent of GDP. Top panel: 100 times the ratio of gross nominal investment in nonresidential structures to nominal GDP. Bottom panel: 100 times the ratio of gross nominal investment in nonresidential equipment to nominal GDP. Data source: BEA Table 1.5.5.
Lower investment spending means not just lower demand for goods and services. Over time it has left us with less productive capital than we would have had if historical trends had continued. There has been a clear slowdown in the rate of growth of the U.S. capital stock since the Great Recession.
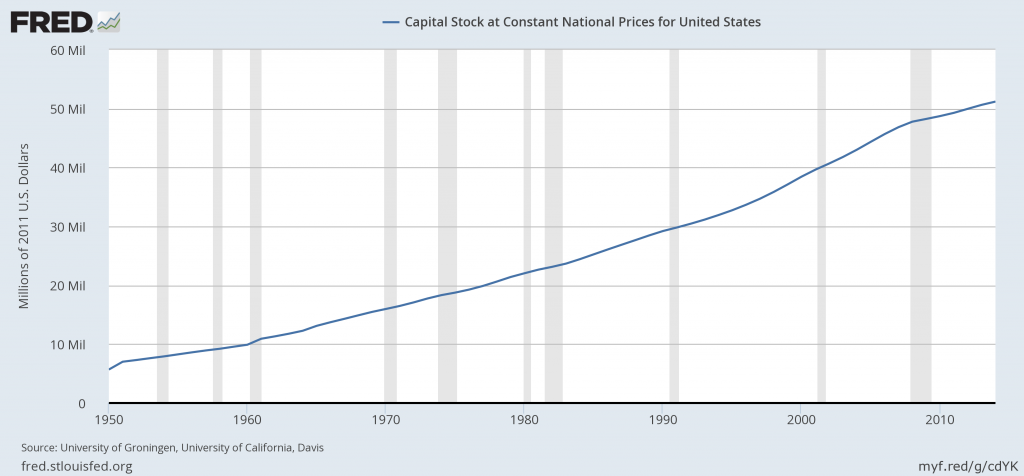
Source: FRED
And slower growth of capital ultimately translates into slower growth of worker productivity. It’s interesting to look at a breakdown of why GDP has grown 1% slower since 2009 than the historical average. Slower growth in employment is a relatively minor factor. Employment has grown at a 1.5% annual growth rate since 2009, compared with the 1.7% since World War II. Instead productivity is the big story. Since the Great Recession ended, labor productivity only grew at a 0.6% annual rate, compared to the 1.4% historical average.
|
Period |
GDP |
employment |
productivity |
|
1947:Q1-2016:Q4 |
3.1% |
1.7% |
1.4% |
|
2009:Q3-2016:Q4 |
2.1% |
1.5% |
0.6% |
|
2012:Q3-2016:Q4 |
2.0% |
1.8% |
0.2% |
And about half of the meager gains in productivity we did see came in the first few years of the recovery. There has been barely any growth since 2012.
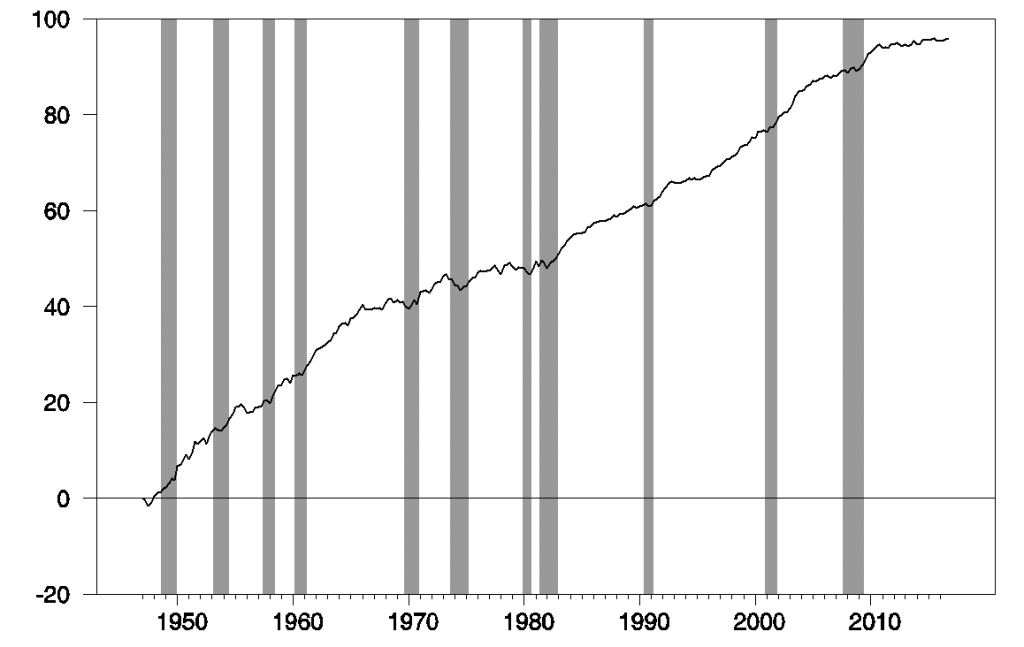
U.S. real GDP per worker, (in logarithms). Values were calculated by taking the natural log of the ratio of real GDP in 2009 dollars to end-of-quarter seasonally adjusted nonfarm payroll employment. Value plotted is 100 times the difference between this number and the corresponding value of 1947:Q1.
There are lots of factors in the long-term slowdown in U.S. investment spending. As we move from brick-and-mortar stores to online sales, we need fewer retail structures. And the surge in business equipment purchases in the 1990s in part reflected a one-time need for every business to computerize. But I’m struck by the fact that the low levels of business fixed investment are mirrored by low spending on new home construction and autos, two consumer-based components of GDP that historically usually exhibit similar cyclical dynamics to nonresidential fixed investment.
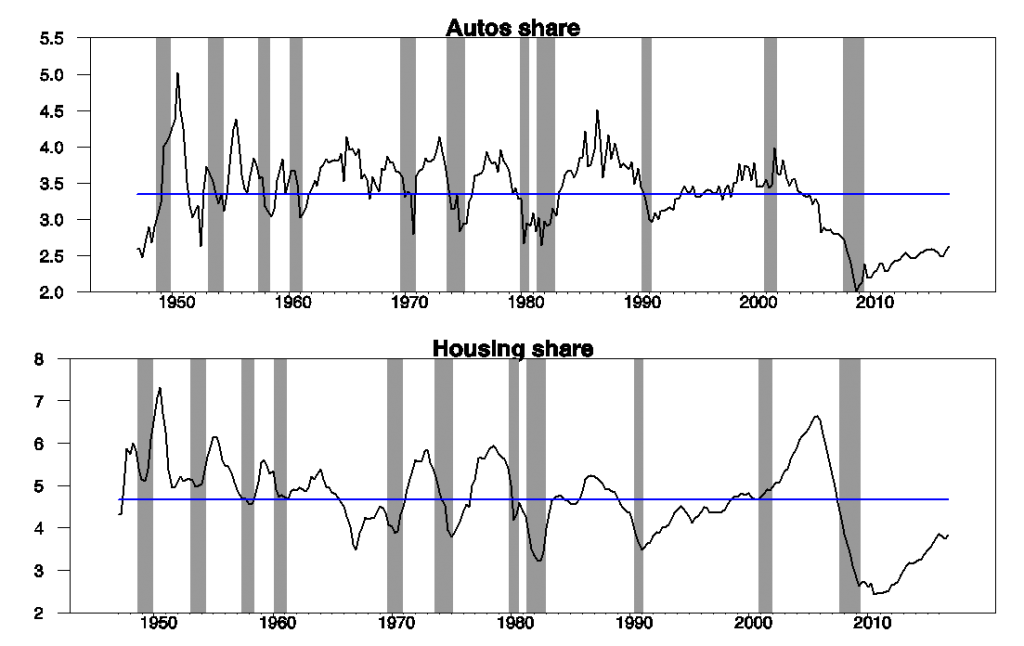
Autos and housing as a percent of GDP. Top panel: 100 times the ratio of nominal spending on motor vehicles and parts to nominal GDP. Bottom panel: 100 times the ratio of gross nominal nonresidential fixed investment nominal GDP. Data source: BEA Table 1.5.5.
Business investment, housing construction, and auto purchases are categories of spending have always been very vulnerable to cyclical downturns. They’re the prime target when firms and consumers feel they need to cut spending and are apprehensive about the future. In many ways, what we saw over 2009-2016 was that typical cyclical behavior continue for a very untypically long period.
If business and consumer confidence in future income growth were to return, we could easily see stronger U.S. economic growth over the next several years than we have over the last eight.
Comments
Log in or sign up to join the conversation.