
All have a positive gradient in Q1.
(Click on image to enlarge)
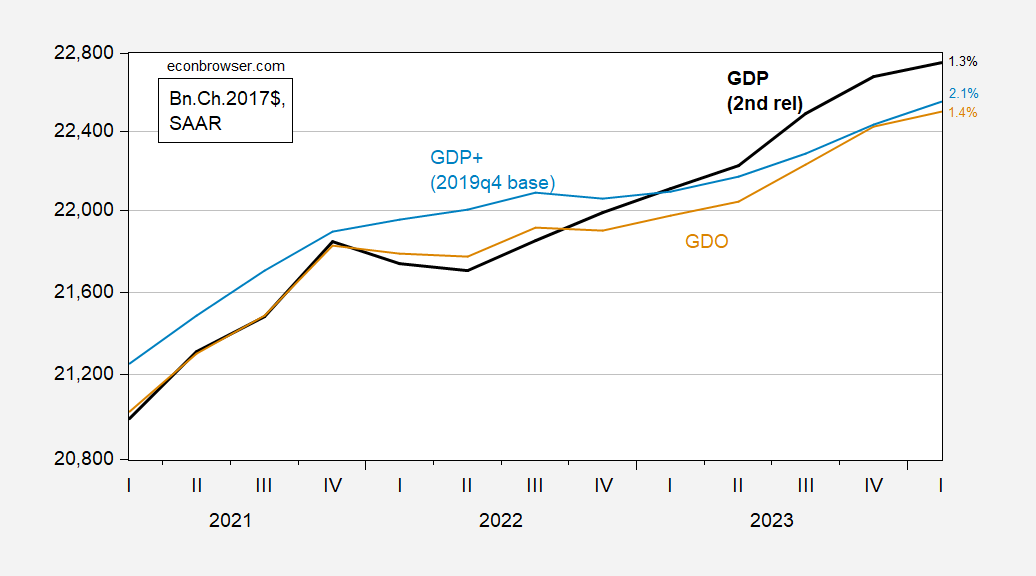
Figure 1: GDP (bold black), GDO (tan), and GDP+ (sky blue), all in bn.Ch.2017$ SAAR. GDP, GDO based on 2nd release. Small % at right are Q1 SAAR growth rates. Source: BEA, Philadelphia Fed, author’s calculations.
Note that GDO for 2023Q4 is revised down, while my estimate for GDO for 2024Q1was too low (see this post); the level of GDO is 0.2 ppts above what I guessed.
Final sales, a measure of aggregate demand, grew at 1.7% q/q SAAR.
More By This Author:
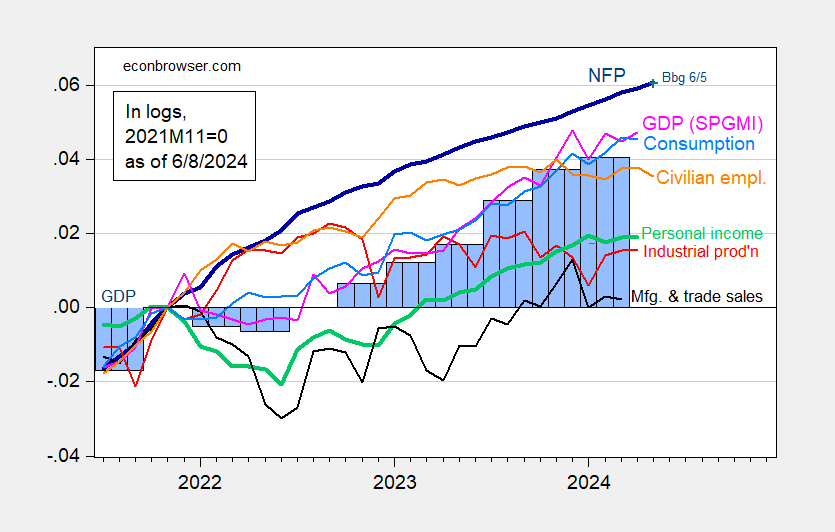
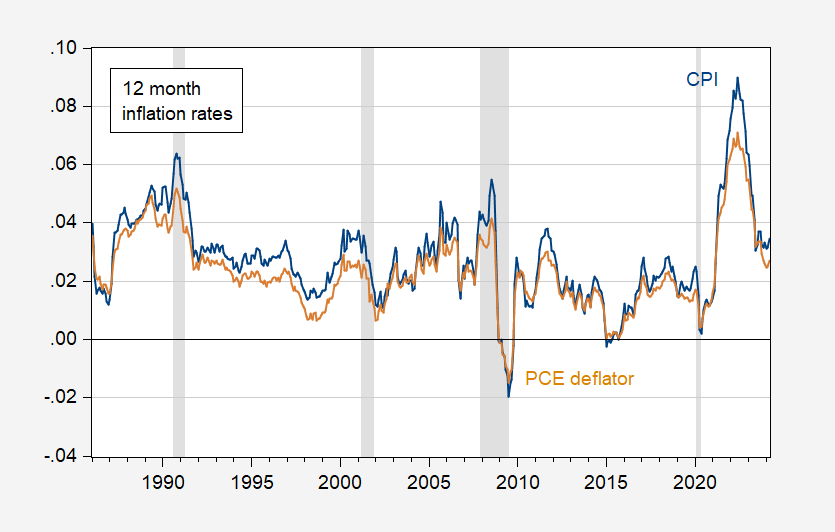
Employment And Business Cycle IndicatorsCPI And PCE Deflator Differential And Differences
Monetary Policy Rates Around The World
Comments
Log in or sign up to join the conversation.