
One argument against the secular stagnation thesis is that the risk-adjusted real rate is not particularly low. I’m dubious.
In Figure 1, I depict the real ten year Treasury yield, adjusted by survey-based inflation expectations (from the Cleveland Fed, Survey of Professional Forecasters), and the TIPS yield.
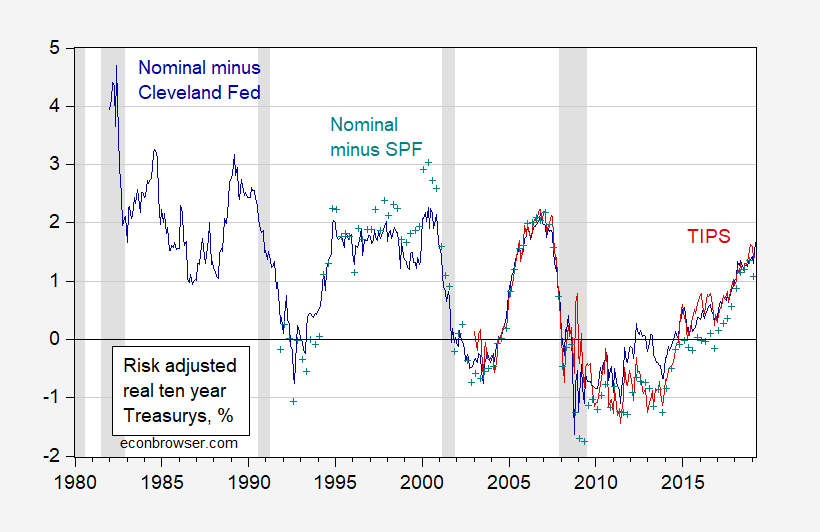
Figure 1: Ten year constant maturity Treasury yield adjusted Cleveland Fed ten year expected inflation and Kim-Wright term spread (dark blue), adjusted by Survey of Professional Forecasters median ten year expected inflation and Kim-Wright term premium (teal +), and TIPS yield adjusted by Kim-Wright term premium (red). NBER defined recession dates shaded gray. Source: Fed, Cleveland Fed, NBER and author’s calculations.
Notice that real risk-free rates have declined, particularly relative to the 1980s. However, it is true that the decline is less apparent than in the typical graph using unadjusted real rates. This is shown in Figure 2.
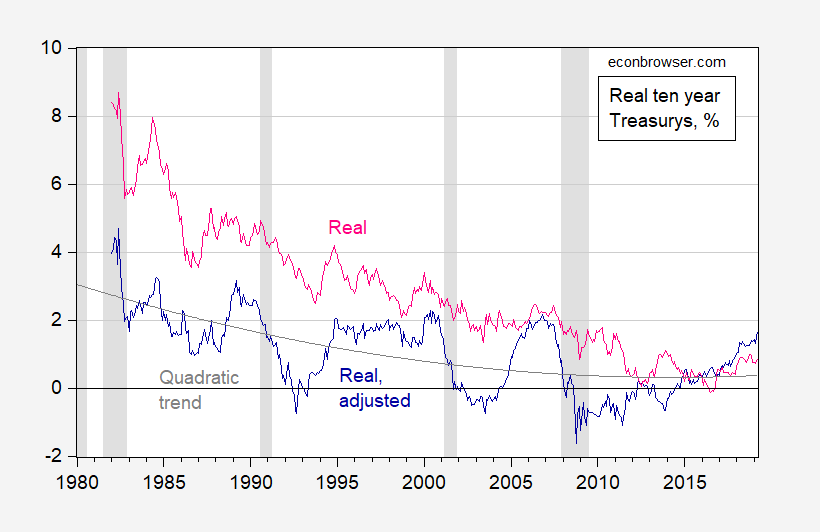
Figure 2: Ten year constant maturity Treasury yield adjusted Cleveland Fed ten year expected inflation and Kim-Wright term spread (dark blue), quadratic trend (gray), and ten year constant maturity Treasury yield adjusted Cleveland Fed ten year expected inflation (pink). NBER defined recession dates shaded gray. Source: Fed, Cleveland Fed, NBER and author’s calculations.
The adjusted real tend year rate is trend stationary (can reject a unit root null). I estimate a quadratic trend shown in Figure 2. The trend is downward sloping, and statistically significantly so. In other words, risk adjusted rates are lower.
It may be the case that the risk adjusted real rate rises in the near future. I will merely note that yet another alternative measure of the (short) risk-free natural rate (Laubach-Williams 1-sided estimate) suggests that real rates are low…
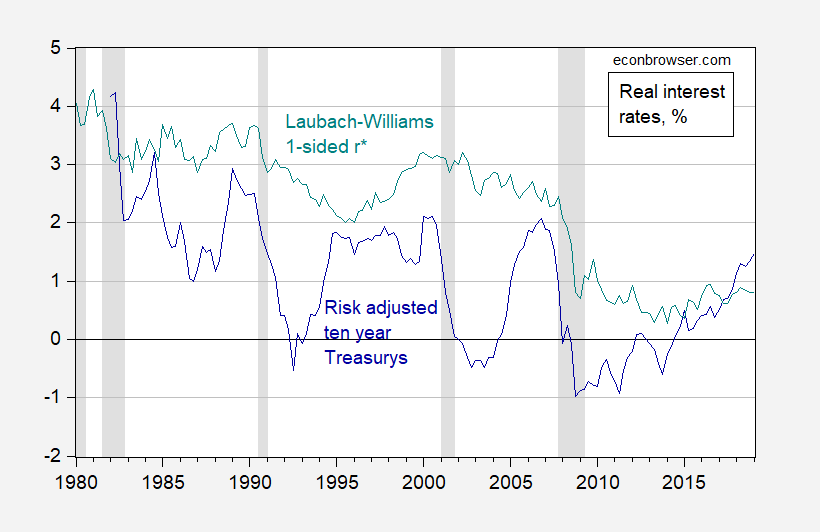
Figure 3: Ten year constant maturity Treasury yield adjusted Cleveland Fed ten year expected inflation and Kim-Wright term spread (dark blue), and Laubach-Williams one-sided estimates of natural rate (teal). NBER defined recession dates shaded gray. Source: Fed, Cleveland Fed, Atlanta Fed, NBER and author’s calculations.


Comments
Log in or sign up to join the conversation.